

Why Engineering Analytics Is Becoming a Core Leadership Skill
Engineering leadership has changed dramatically over the past decade. Building great software is no longer just about hiring talented developers, choosing the right technology stack, or delivering features on schedule. Today’s engineering leaders are expected to improve productivity, optimize team performance, manage budgets, reduce technical debt, and support business growth—all at the same time.
Meeting these expectations requires more than experience and instinct. While intuition still has value, it is no longer enough to lead high-performing engineering organizations. Modern leaders increasingly rely on engineering analytics to make informed decisions, identify opportunities, and measure progress with confidence.
As software development becomes more complex and distributed, engineering analytics is evolving from a helpful reporting tool into a fundamental leadership capability.
The Shift from Gut Feeling to Data-Driven Leadership
For years, engineering management often depended on personal observations and informal feedback. Leaders assessed productivity by attending meetings, reviewing project updates, or simply trusting that teams were making steady progress.
While these approaches can provide valuable context, they often fail to reveal deeper organizational patterns. Important issues may remain hidden until deadlines slip, customer satisfaction declines, or valuable engineers become disengaged.
Engineering analytics changes this dynamic by providing measurable insights into how software teams operate. Instead of relying solely on assumptions, leaders gain visibility into the actual health of their engineering organization.
This shift enables better decision-making across areas such as:
- Delivery performance
- Team collaboration
- Development efficiency
- Software quality
- Resource allocation
- Process improvement
Rather than replacing human judgment, analytics strengthens it by providing objective information that supports better leadership decisions.
Why Software Organizations Need Better Visibility

Modern software development involves countless moving parts.
Engineering teams often work across multiple products, cloud environments, deployment pipelines, repositories, and communication platforms. Remote and hybrid work models have added another layer of complexity, making it more difficult to understand how work progresses across the organization.
Without reliable metrics, leaders may struggle to answer important questions such as:
- Are teams spending too much time waiting for code reviews?
- Which projects consistently experience delivery delays?
- Is technical debt slowing down feature development?
- Are engineering investments producing measurable business value?
- Which teams need additional support?
Engineering analytics transforms scattered development data into meaningful insights that help leaders answer these questions with confidence.
Measuring What Actually Matters
One of the biggest misconceptions about engineering analytics is that it exists to monitor developer activity. In reality, effective analytics focuses on improving systems rather than evaluating individuals.
Healthy engineering organizations prioritize metrics that reveal how work flows through the development process instead of tracking personal productivity.
Some of the most valuable indicators include:
Delivery Speed
Understanding how quickly work moves from planning to production helps leaders identify bottlenecks and improve release efficiency.
Important measurements often include:
- Lead time
- Cycle time
- Deployment frequency
- Time to production
These metrics reveal whether engineering teams can consistently deliver value without sacrificing quality.
Software Quality
Fast delivery has little value if releases introduce frequent bugs or service disruptions.
Engineering analytics helps monitor quality through indicators like:
- Defect trends
- Production incidents
- Failed deployments
- Rollback frequency
- Mean time to recovery
These measurements allow leaders to balance speed with long-term reliability.
Team Health
Successful engineering organizations recognize that sustainable performance depends on healthy teams.
Analytics can highlight patterns related to:
- Workload distribution
- Review turnaround times
- Collaboration across teams
- Long-running pull requests
- Work in progress
These insights help prevent burnout while improving overall efficiency.
Supporting Better Strategic Decisions
Engineering leaders spend a significant portion of their time making strategic decisions that affect the entire organization.
Examples include:
- Expanding engineering teams
- Investing in platform improvements
- Prioritizing technical debt
- Introducing automation
- Planning product roadmaps
Without data, these decisions often rely on incomplete information.
Engineering analytics provides objective evidence that supports better prioritization.
For example, analytics may reveal that developers spend excessive time waiting for testing environments rather than writing code. Instead of hiring more engineers, leadership might achieve greater productivity by improving infrastructure.
Similarly, analytics can demonstrate whether investments in continuous integration, deployment automation, or developer tooling actually improve delivery performance.
Aligning Engineering with Business Goals

Engineering does not operate independently from the rest of the business.
Executives increasingly expect technology leaders to demonstrate how engineering investments contribute to organizational success.
Engineering analytics helps connect technical performance with broader business objectives by showing how improvements influence:
- Product delivery
- Customer satisfaction
- Operational stability
- Revenue growth
- Innovation capacity
- Development costs
This alignment allows engineering leaders to communicate more effectively with executives, finance teams, and other business stakeholders.
Instead of discussing only technical details, they can present measurable outcomes that clearly support strategic business priorities.
Creating a Culture of Continuous Improvement
High-performing engineering organizations rarely treat analytics as a reporting exercise.
Instead, they use data to encourage ongoing learning and process improvement.
When teams regularly review engineering metrics, they can identify recurring challenges, experiment with new approaches, and measure whether changes produce better outcomes.
Examples include:
- Improving code review practices
- Reducing deployment delays
- Simplifying development workflows
- Increasing test automation
- Eliminating recurring bottlenecks
Over time, small improvements accumulate into significant organizational gains.
Importantly, successful leaders emphasize that analytics exists to improve systems—not to assign blame. This mindset encourages openness, collaboration, and continuous learning rather than fear or unhealthy competition.
Avoiding Common Pitfalls
Although engineering analytics offers substantial benefits, its value depends on thoughtful implementation.
Leaders should avoid several common mistakes.
Measuring Too Many Metrics
Collecting dozens of dashboards rarely leads to better decisions.
Instead, organizations should focus on a manageable set of metrics that directly support strategic goals.
Using Metrics as Performance Rankings
Individual developer rankings often create unintended consequences.
Developers may optimize for numbers instead of delivering meaningful business value.
Engineering analytics should improve organizational performance rather than encourage competition between team members.
Ignoring Context
No metric tells the complete story.
For example, longer delivery times may result from intentional architectural improvements rather than reduced productivity.
Effective leaders combine quantitative data with conversations, team feedback, and business context before making decisions.
The Role of Analytics in Modern Engineering Leadership

Today’s engineering managers wear many hats.
They serve as technical advisors, mentors, strategic planners, operational leaders, and business partners. Managing these responsibilities successfully requires visibility into both technical execution and organizational performance.
Engineering analytics enables leaders to:
- Detect emerging risks early
- Allocate resources more effectively
- Improve delivery predictability
- Support healthier engineering teams
- Demonstrate business impact
- Build more resilient development processes
Rather than reacting to problems after they occur, leaders can proactively identify trends and make informed adjustments before small issues become major obstacles.
Looking Ahead
As software organizations continue to grow in size and complexity, engineering leadership will become increasingly data-informed. Companies that embrace engineering analytics gain a clearer understanding of how their teams operate, where inefficiencies exist, and which improvements deliver the greatest impact.
The future of engineering management is not about replacing experience or intuition—it is about enhancing both with reliable, actionable insights. Leaders who combine technical expertise with measurable outcomes are better equipped to guide their teams, communicate with stakeholders, and drive sustainable success.
Engineering analytics is no longer a niche capability reserved for large technology companies. It has become an essential leadership skill that empowers engineering organizations to deliver higher-quality software, make smarter strategic decisions, and continuously improve in an increasingly competitive digital landscape.

The Metrics That Actually Matter: Moving Beyond Lines of Code
For decades, organizations searched for a simple way to measure software engineering productivity. One of the earliest—and most persistent—approaches was counting lines of code. The assumption seemed logical: more code meant more work, and therefore greater productivity.
Today, we know that software development is far more complex than that. Writing thousands of lines of code does not necessarily create better software, solve customer problems faster, or deliver greater business value. In many cases, the opposite is true. Elegant solutions often require less code, not more.
As engineering organizations mature, they are replacing activity-based measurements with metrics that provide meaningful insights into delivery performance, software quality, collaboration, and customer impact. The goal is no longer to measure how busy developers are but to understand how effectively engineering teams create value.
Why Lines of Code Is a Poor Productivity Metric
At first glance, lines of code (LOC) appears to be an objective measurement. It is easy to collect, compare, and report. However, it tells very little about the quality or effectiveness of engineering work.
Consider two developers working on similar problems:
- One writes 2,000 lines of new code.
- Another simplifies an existing system by removing 1,500 unnecessary lines while improving performance and reliability.
Which developer delivered more value?
In many cases, the second developer made the greater contribution. Reducing complexity often improves maintainability, lowers future costs, and decreases the likelihood of defects.
Measuring output by code volume encourages behaviors that rarely benefit the business, such as:
- Writing overly complex solutions
- Avoiding code refactoring
- Duplicating existing functionality
- Prioritizing quantity over quality
- Discouraging simplification
Great engineering is about solving problems efficiently—not producing the largest amount of code.
The Difference Between Activity and Outcomes

Many traditional engineering metrics focus on activity rather than results.
Activity metrics answer questions like:
- How many commits were made?
- How many pull requests were opened?
- How many tickets were completed?
- How many hours were logged?
While these measurements can provide useful operational context, they rarely indicate whether engineering efforts are producing meaningful outcomes.
Outcome-focused metrics instead evaluate whether teams are delivering software efficiently, maintaining quality, and supporting business objectives.
This shift allows engineering leaders to understand not just what teams are doing, but whether those efforts are making a measurable impact.
Delivery Metrics That Reflect Engineering Effectiveness
One of the strongest indicators of engineering performance is how smoothly work moves from idea to production.
Lead Time
Lead time measures how long it takes for work to progress from request to customer delivery.
Shorter lead times often indicate:
- Efficient planning
- Effective collaboration
- Healthy development processes
- Faster customer value
Long lead times may reveal unnecessary approvals, workflow bottlenecks, or process inefficiencies.
Cycle Time
Cycle time focuses specifically on the period between active development and completed delivery.
Monitoring cycle time helps teams identify delays in areas such as:
- Code reviews
- Testing
- Deployment
- Release approvals
Reducing cycle time often improves responsiveness without increasing workload.
Deployment Frequency
High-performing engineering organizations release software regularly rather than relying on large, infrequent deployments.
Frequent deployments typically indicate:
- Strong automation
- Reliable testing
- Smaller code changes
- Lower release risk
Smaller releases are generally easier to validate, troubleshoot, and roll back if needed.
Quality Metrics That Protect Long-Term Success
Speed alone does not define engineering excellence. Sustainable software development requires balancing delivery velocity with product quality.
Important quality indicators include:
Change Failure Rate
This metric measures how often deployments introduce issues requiring fixes, rollbacks, or emergency interventions.
Lower failure rates suggest:
- Better testing
- Strong review practices
- Stable release processes
Mean Time to Recovery (MTTR)
Even well-tested systems occasionally experience failures.
MTTR measures how quickly engineering teams restore normal service after an incident.
Fast recovery demonstrates:
- Effective monitoring
- Strong operational practices
- Clear incident response procedures
Customers often remember how quickly problems are resolved as much as the problems themselves.
Defect Trends
Tracking production defects over time provides insight into software quality beyond individual releases.
Rather than counting bugs in isolation, leaders should monitor whether defect rates improve, remain stable, or increase as systems evolve.
Measuring Team Health Instead of Individual Output

Engineering success depends heavily on collaboration.
Software is rarely built by isolated individuals working independently. Designers, developers, testers, product managers, security specialists, and operations teams all contribute to successful delivery.
Healthy engineering metrics therefore focus on team performance rather than individual rankings.
Useful indicators include:
- Pull request review turnaround
- Work-in-progress limits
- Collaboration across repositories
- Knowledge sharing
- Workload distribution
These metrics help leaders identify organizational challenges without encouraging unhealthy competition.
When analytics is used to compare individual developers, it often produces unintended consequences, such as reduced collaboration or attempts to optimize personal statistics instead of customer outcomes.
Technical Debt Is a Metric Worth Tracking
Organizations often focus heavily on new feature development while overlooking technical debt.
Over time, accumulated technical debt slows development, increases maintenance costs, and reduces engineering flexibility.
Important indicators include:
- Aging dependencies
- Code complexity
- Test coverage trends
- Infrastructure reliability
- Refactoring backlog
- Time spent on maintenance work
Monitoring these areas helps leaders make informed investment decisions before technical debt becomes a major obstacle.
Connecting Engineering Metrics to Business Value
The most valuable engineering metrics extend beyond technical performance.
Leadership teams increasingly want to understand how engineering contributes to overall business success.
Strong engineering metrics help answer questions such as:
- Are customers receiving new features faster?
- Has product reliability improved?
- Are operational costs decreasing?
- Is engineering becoming more predictable?
- Are development investments producing measurable returns?
When engineering metrics connect directly to customer experience and business outcomes, they become far more meaningful than isolated technical statistics.
For example, reducing deployment time by 60% matters because it allows customers to receive improvements sooner—not simply because the deployment process became faster.
Choosing Metrics That Drive Better Decisions
Not every metric deserves executive attention.
The best engineering organizations select a focused set of measurements that align with strategic objectives rather than collecting every available data point.
Effective metrics typically share several characteristics:
- They support decision-making.
- They encourage healthy engineering behaviors.
- They improve collaboration.
- They reveal trends over time.
- They connect technical work with business goals.
- They are easy to understand and explain.
Metrics that exist only to populate dashboards rarely lead to meaningful improvements.
Building a Metrics Culture Without Creating Fear

Introducing engineering analytics requires careful communication.
Developers often worry that metrics will be used for surveillance or performance evaluations. Leaders can address these concerns by emphasizing that analytics is intended to improve systems—not monitor individuals.
A healthy metrics culture encourages teams to:
- Identify workflow bottlenecks.
- Experiment with process improvements.
- Measure the impact of changes.
- Share learnings across teams.
- Continuously refine engineering practices.
When teams trust how metrics are used, they are more likely to engage with the data and contribute ideas for improvement.
Focusing on What Truly Matters
Modern engineering organizations recognize that productivity cannot be captured by counting lines of code, commits, or completed tickets. These activity metrics offer only a partial view of performance and often encourage behaviors that do little to improve software or customer outcomes.
The metrics that truly matter measure how effectively teams deliver reliable software, collaborate across functions, respond to change, and create business value. They provide leaders with actionable insights instead of superficial statistics and help organizations continuously improve without losing sight of quality or long-term sustainability.
By moving beyond lines of code and embracing outcome-focused analytics, engineering leaders gain a clearer understanding of what drives success. Instead of rewarding activity for its own sake, they can foster an environment where engineering excellence is defined by meaningful impact, resilient systems, and the consistent delivery of value to customers and the business alike.

Engineering Productivity Without Micromanagement
Measuring engineering productivity has always been a challenge. Unlike manufacturing or sales, software development is a creative, collaborative process where progress cannot be accurately captured by a single number. Yet engineering leaders still need visibility into how teams are performing, where bottlenecks exist, and whether investments are producing results.
The difficulty lies in finding the right balance. Organizations need meaningful data to improve performance, but excessive monitoring can quickly erode trust, reduce motivation, and create a culture where developers optimize for metrics instead of building great software.
The most successful engineering organizations understand that productivity and autonomy are not opposing goals. By focusing on team outcomes rather than individual activity, leaders can gain valuable insights while preserving the independence that allows engineers to do their best work.
Why Micromanagement Hurts Engineering Teams
Software engineers solve complex problems that often require experimentation, collaboration, and deep concentration. Constant oversight interrupts these processes and can have unintended consequences.
Micromanagement often leads to:
- Reduced creativity
- Lower morale
- Slower decision-making
- Increased stress and burnout
- Less ownership of work
- Higher employee turnover
When developers feel every action is being measured or questioned, they naturally become more cautious. Instead of focusing on delivering the best solution, they may begin optimizing for whatever metric leadership appears to value.
This shift rarely improves productivity. More often, it encourages short-term thinking and discourages innovation.
Why Traditional Productivity Metrics Fall Short
Many organizations still rely on activity-based measurements such as:
- Lines of code written
- Number of commits
- Hours worked
- Tickets completed
- Pull requests created
While these metrics are easy to collect, they provide limited insight into actual engineering performance.
For example, an engineer who removes outdated code, simplifies an architecture, or prevents a major production issue may appear less productive according to these measurements than someone who simply produces a large volume of code.
Activity does not always equal impact.
Effective engineering leadership recognizes that productivity should be measured by outcomes rather than visible effort.
Shift the Focus from Individuals to Teams

Modern software development is highly collaborative. Designers, developers, quality engineers, product managers, security specialists, and operations teams all contribute to successful product delivery.
Because of this, evaluating individuals in isolation often produces misleading conclusions.
Instead, leaders should examine how well entire teams perform.
Questions worth asking include:
- Is work flowing efficiently?
- Are releases becoming more predictable?
- Is software quality improving?
- Are bottlenecks decreasing?
- Are customers receiving value faster?
These questions encourage system-level improvements instead of individual comparisons.
When leaders optimize the system rather than the people within it, productivity naturally improves.
Measure Delivery Instead of Developer Activity
One of the healthiest ways to evaluate engineering effectiveness is by examining how efficiently work moves through the development process.
Useful delivery metrics include:
Lead Time
Lead time measures how long it takes for work to progress from request to production.
Reducing lead time often reflects improvements in planning, collaboration, testing, and deployment rather than simply asking engineers to work faster.
Cycle Time
Cycle time focuses on active development and delivery.
Tracking this metric helps identify delays caused by:
- Long review cycles
- Manual testing
- Deployment bottlenecks
- Approval processes
These insights allow leaders to improve workflows without placing additional pressure on individual contributors.
Deployment Frequency
Frequent deployments generally indicate mature engineering practices.
Smaller releases reduce risk, simplify troubleshooting, and enable faster customer feedback.
Rather than measuring how much developers produce, deployment frequency measures how consistently organizations deliver value.
Prioritize Quality Alongside Speed
Fast delivery means little if software quality suffers.
Healthy engineering organizations balance delivery metrics with quality indicators such as:
- Production incidents
- Failed deployments
- Defect trends
- Rollback frequency
- Mean time to recovery
Monitoring both speed and quality prevents teams from sacrificing long-term stability for short-term output.
When quality improves alongside delivery performance, productivity gains become sustainable.
Protect Developer Autonomy
Autonomy is one of the strongest drivers of engineering motivation.
Developers perform best when they have the freedom to:
- Solve problems creatively
- Choose appropriate technical approaches
- Collaborate openly
- Experiment with improvements
- Take ownership of outcomes
Engineering analytics should support these behaviors—not restrict them.
Instead of using dashboards to monitor every action, leaders can use analytics to identify where teams may need additional resources, improved tooling, or simplified processes.
The conversation shifts from:
“Why aren’t developers working harder?”
to:
“What obstacles are preventing the team from succeeding?”
This simple change in perspective builds trust while encouraging continuous improvement.
Build Transparency Around Metrics

Metrics become far more effective when everyone understands their purpose.
Engineering leaders should clearly explain:
- What is being measured
- Why it matters
- How the data will be used
- Which decisions it supports
Transparency reduces uncertainty and helps developers view analytics as a tool for improvement rather than surveillance.
It is equally important to share the results openly.
When teams regularly review engineering metrics together, they can identify opportunities, celebrate improvements, and collaborate on solutions.
This creates shared ownership instead of top-down accountability.
Use Metrics to Improve Systems, Not Judge People
One of the biggest mistakes organizations make is using engineering metrics as performance rankings.
Leaderboards based on commits, tickets, or pull requests often encourage counterproductive behaviors such as:
- Making unnecessary code changes
- Splitting work into smaller tasks solely to increase counts
- Avoiding collaboration
- Prioritizing speed over quality
Instead, metrics should reveal opportunities to improve the development system itself.
Examples include:
- Reducing code review delays
- Improving automated testing
- Simplifying deployment pipelines
- Removing unnecessary approvals
- Investing in better development tools
These improvements benefit every engineer rather than rewarding individual statistics.
Trust Is the Foundation of Productivity
High-performing engineering teams share one characteristic above almost everything else: trust.
Developers trust that leadership supports them.
Managers trust engineers to make sound technical decisions.
Teams trust each other to collaborate effectively.
Poorly implemented productivity measurement can damage this trust surprisingly quickly.
Leaders strengthen trust by:
- Measuring outcomes instead of activity.
- Avoiding individual productivity rankings.
- Encouraging open discussions about metrics.
- Using data to remove obstacles.
- Recognizing collaborative success.
When engineers believe metrics exist to help rather than monitor them, they become far more willing to participate in improvement initiatives.
Creating a Healthy Engineering Metrics Culture
Successful organizations treat engineering analytics as an ongoing learning process rather than a reporting exercise.
A healthy metrics culture encourages teams to:
- Identify workflow bottlenecks
- Experiment with process improvements
- Measure the results of changes
- Share successful practices across teams
- Continuously refine development workflows
The objective is not perfection but steady improvement.
Small gains in efficiency, collaboration, and software quality accumulate over time into significant organizational advantages.
Balancing Visibility and Freedom
Engineering leaders need visibility into how software organizations perform, but visibility should never come at the expense of developer autonomy. The most valuable insights come from measuring systems, workflows, and outcomes—not tracking every individual action.
By focusing on delivery performance, software quality, collaboration, and customer value, organizations can make informed decisions without creating a culture of micromanagement. Engineers remain empowered to solve complex problems, take ownership of their work, and innovate, while leaders gain the information they need to improve processes and support long-term success.
Ultimately, engineering productivity is not about watching developers more closely. It is about building an environment where talented teams have the trust, tools, and processes needed to do their best work. When analytics is used to remove barriers instead of monitor behavior, organizations achieve both higher performance and a healthier engineering culture.
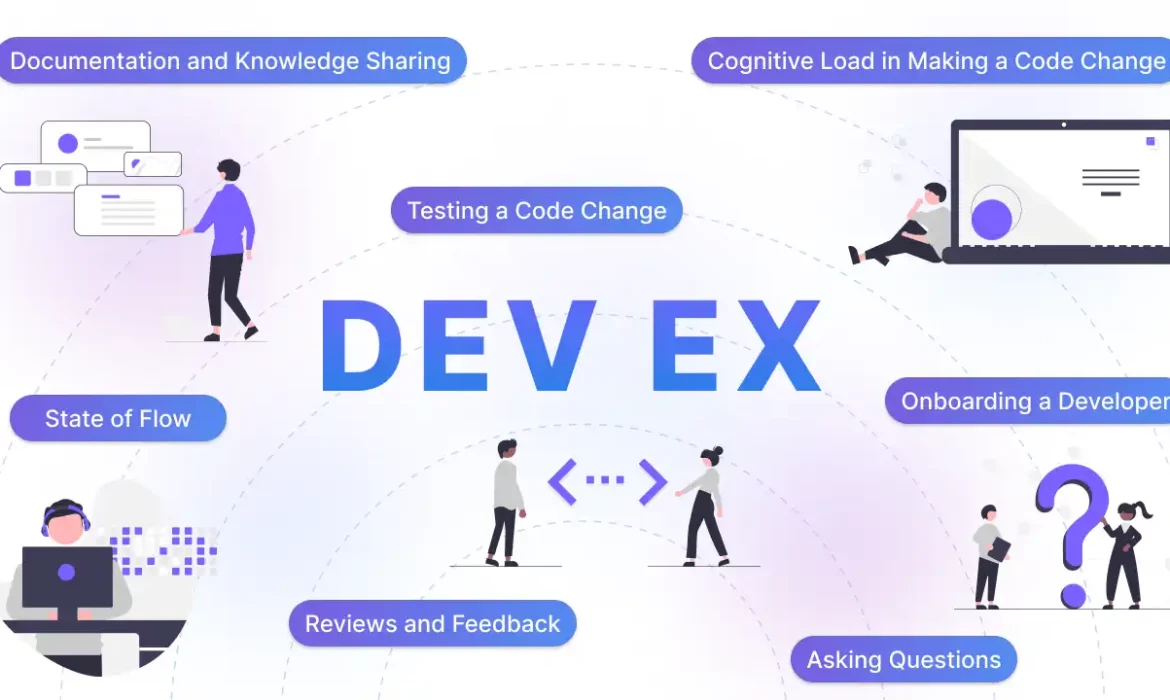
Developer Experience (DevEx): The Hidden Driver of Delivery Speed
Software development is often viewed through the lens of technical architecture, project management, or engineering talent. While these factors are undeniably important, many organizations overlook one of the biggest influences on engineering performance: Developer Experience (DevEx).
Developer Experience encompasses everything engineers interact with during their daily work—from development environments and deployment pipelines to documentation, internal tools, and team processes. When these systems are intuitive and efficient, developers spend more time solving customer problems and less time navigating unnecessary obstacles.
Improving Developer Experience is not simply about making developers happier. It has a direct impact on delivery speed, software quality, collaboration, and employee retention. As software organizations become more complex, DevEx is emerging as one of the most effective ways to increase engineering productivity without increasing headcount.
What Is Developer Experience?
Developer Experience refers to the overall quality of an engineer’s interaction with the tools, systems, workflows, and processes required to build and maintain software.
A positive Developer Experience enables engineers to:
- Set up development environments quickly
- Access reliable documentation
- Deploy software with confidence
- Resolve issues efficiently
- Collaborate across teams
- Focus on building features instead of fighting infrastructure
Conversely, a poor Developer Experience creates constant friction that slows development and increases frustration.
Even small inefficiencies, when repeated across dozens or hundreds of engineers every day, can result in significant productivity losses.
The Hidden Cost of Engineering Friction
Engineering teams rarely lose productivity because developers lack technical ability.
More often, valuable time disappears through small interruptions such as:
- Waiting for build pipelines
- Searching for outdated documentation
- Resolving dependency conflicts
- Navigating complicated deployment processes
- Waiting for code reviews
- Troubleshooting inconsistent development environments
Each interruption may seem minor on its own, but together they create substantial delays.
For example, if every engineer loses just 30 minutes each day due to workflow friction, a team of 50 developers loses hundreds of engineering hours every month. That lost time could otherwise be spent delivering features, fixing bugs, or improving software quality.
Reducing friction is one of the fastest ways to improve overall engineering performance.
Faster Developers Build Better Software
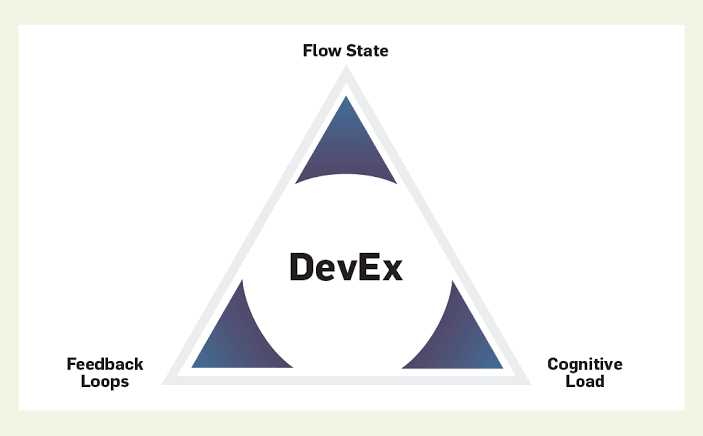
Speed and quality are often treated as competing priorities, but Developer Experience demonstrates that they can improve together.
When engineers spend less time dealing with operational obstacles, they gain more time for activities that enhance software quality, including:
- Thoughtful system design
- Comprehensive testing
- Code refactoring
- Peer collaboration
- Documentation
- Performance optimization
Instead of rushing through repetitive tasks, developers can focus on solving complex problems and creating maintainable solutions.
As a result, organizations often experience both faster delivery cycles and more reliable software.
Why Internal Tools Matter More Than You Think
Organizations frequently invest heavily in customer-facing products while neglecting the tools their own engineers use every day.
Internal developer platforms, deployment systems, CI/CD pipelines, testing frameworks, and documentation portals may not generate revenue directly, but they significantly influence engineering efficiency.
Strong internal tooling can reduce:
- Manual deployment steps
- Configuration errors
- Repetitive setup tasks
- Environment inconsistencies
- Context switching
When developers trust their tools, they spend less time troubleshooting and more time delivering customer value.
Investing in internal platforms is therefore an investment in long-term engineering productivity.
Developer Experience Improves Delivery Velocity
One of the clearest benefits of DevEx is faster software delivery.
Teams with streamlined workflows typically experience improvements in:
Lead Time
Developers move work from planning to production more quickly because fewer manual processes interrupt delivery.
Cycle Time
Code progresses through development, testing, review, and deployment with fewer delays.
Deployment Frequency
Reliable automation encourages smaller, more frequent releases that reduce deployment risk.
Recovery Speed
Improved tooling enables engineers to identify and resolve production issues more efficiently.
These improvements allow organizations to respond faster to customer needs while maintaining operational stability.
Better Workflows Lead to Higher Software Quality
Poor Developer Experience often encourages shortcuts.
When deployment is difficult, testing is slow, or documentation is incomplete, developers naturally look for ways to bypass friction in order to meet deadlines.
This can result in:
- Incomplete testing
- Larger deployments
- Increased technical debt
- More production defects
- Higher maintenance costs
Improving Developer Experience removes many of the incentives for these risky behaviors.
Engineers become more likely to:
- Write automated tests
- Review code thoroughly
- Refactor complex systems
- Improve documentation
- Follow established engineering practices
The result is software that is both more reliable and easier to maintain.
Developer Experience Supports Employee Retention
Hiring experienced software engineers is expensive and highly competitive.
Retaining talented developers is therefore just as important as recruiting them.
Developer Experience plays a significant role in job satisfaction.
Engineers want to spend their time building software—not struggling with inefficient processes or outdated tooling.
Organizations that invest in DevEx often see improvements in:
- Employee engagement
- Job satisfaction
- Team morale
- Collaboration
- Knowledge sharing
- Long-term retention
A smooth development environment signals that leadership values engineering productivity and respects developers’ time.
This contributes to a healthier engineering culture where people are more likely to remain and grow.
Measuring Developer Experience
Although Developer Experience includes subjective elements, it can still be evaluated using meaningful metrics.
Engineering leaders commonly examine indicators such as:
- Development environment setup time
- Build duration
- Deployment success rate
- Code review turnaround time
- Documentation quality
- Developer satisfaction surveys
- Time spent resolving infrastructure issues
Combining operational metrics with developer feedback provides a balanced view of where friction exists and which improvements will have the greatest impact.
The goal is not to measure developers—it is to measure how effectively the engineering environment supports their work.
Building a Culture That Prioritizes DevEx
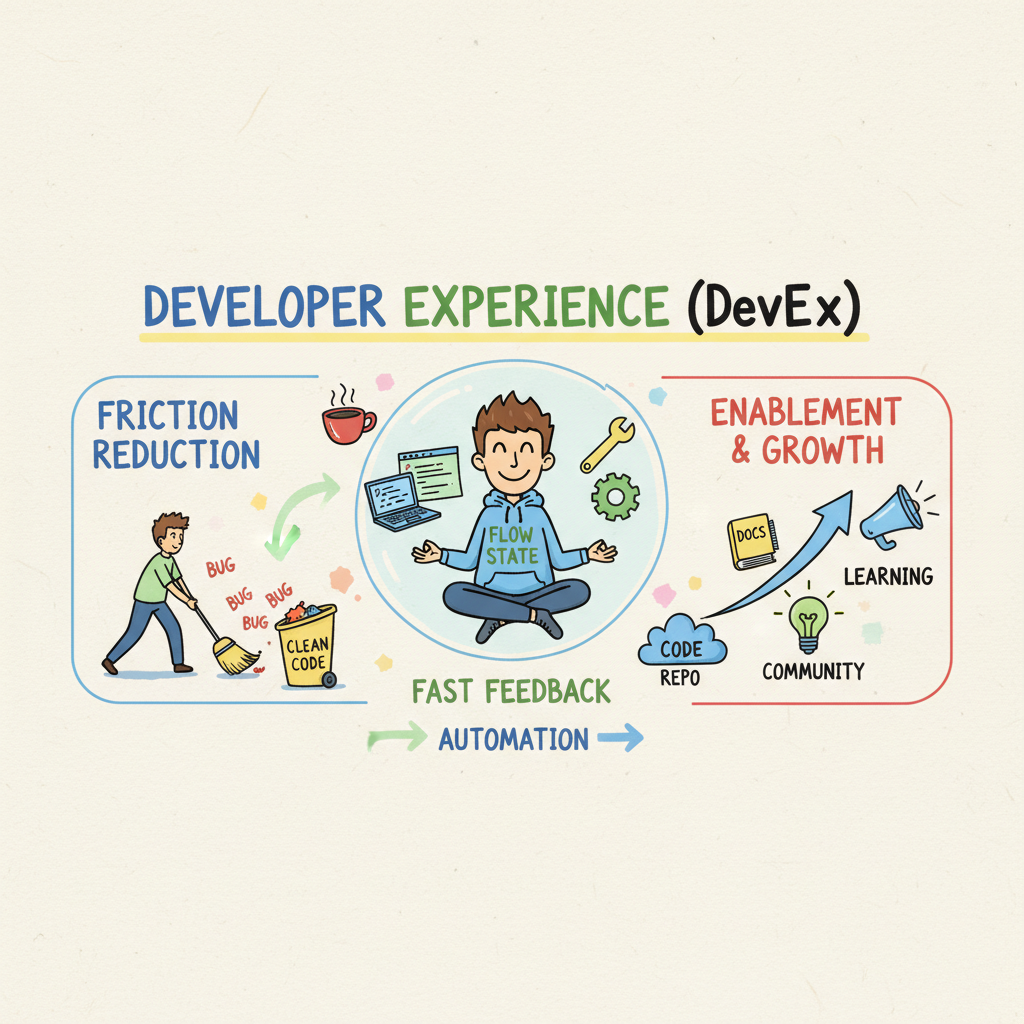
Improving Developer Experience is not a one-time initiative. It requires ongoing attention as systems, teams, and products evolve.
Successful organizations treat DevEx as a strategic priority by:
- Continuously gathering developer feedback.
- Automating repetitive tasks wherever possible.
- Investing in reliable internal platforms.
- Maintaining accurate documentation.
- Simplifying deployment and testing workflows.
- Regularly reviewing engineering processes for unnecessary complexity.
Small improvements made consistently often produce greater long-term gains than large, infrequent transformation projects.
Most importantly, leaders recognize that developer productivity depends not only on individual talent but also on the quality of the environment in which engineers work.
Why Leadership Should Care About Developer Experience
Developer Experience is often perceived as an engineering concern, but its effects extend throughout the business.
A strong DevEx contributes to:
- Faster product delivery
- Higher software quality
- Lower operational costs
- More predictable release schedules
- Improved customer satisfaction
- Better employee retention
These outcomes directly support business growth and competitive advantage.
Engineering leaders who prioritize Developer Experience are not simply improving workflows—they are creating conditions where teams can consistently perform at their highest level.
Turning Developer Experience Into a Competitive Advantage
As software development grows more complex, organizations can no longer rely solely on hiring exceptional engineers to achieve exceptional results. The systems, tools, and processes surrounding those engineers play an equally important role in determining how effectively they deliver value.
Developer Experience is the foundation that enables high-performing teams to move quickly without sacrificing quality. By reducing friction, simplifying workflows, and investing in the tools developers rely on every day, organizations empower engineers to focus on innovation instead of operational obstacles.
The companies that treat Developer Experience as a strategic investment—not just an internal convenience—are better positioned to deliver reliable software faster, retain top engineering talent, and adapt to changing business demands. In an increasingly competitive technology landscape, improving DevEx is no longer a luxury. It is a powerful driver of sustainable engineering success.
How Elite Engineering Teams Use Data to Improve Delivery
Building high-performing software teams is about more than hiring talented engineers or adopting the latest technologies. The most successful engineering organizations consistently deliver reliable software because they understand how work flows through their development process and use data to improve it over time.
Rather than relying on assumptions or reacting to problems after they occur, elite engineering teams use engineering analytics to uncover bottlenecks, measure the impact of process changes, and make informed decisions. Their focus is not on monitoring developers but on optimizing the systems that enable great work.
By turning engineering data into actionable insights, these teams improve delivery speed, maintain software quality, and create a culture of continuous improvement.
Why Data Matters in Modern Engineering
Software development involves hundreds of interconnected activities, from planning and coding to testing, reviewing, deploying, and maintaining applications.
Without visibility into these workflows, engineering leaders often struggle to answer important questions, such as:
- Why are releases taking longer than expected?
- Where do projects consistently slow down?
- Which processes create unnecessary delays?
- Is technical debt affecting delivery speed?
- Are engineering improvements producing measurable results?
Instead of relying on intuition, elite engineering teams use data to identify patterns, validate assumptions, and prioritize improvements based on evidence.
This approach enables smarter decision-making while reducing guesswork.
Focus on the Flow of Work

High-performing engineering organizations understand that productivity depends on how efficiently work moves through the development pipeline.
Rather than measuring individual output, they analyze the entire delivery process.
Key questions include:
- How long does work wait before development begins?
- How quickly are pull requests reviewed?
- Where do deployments become delayed?
- Which approval steps add unnecessary complexity?
- How often are releases interrupted by production issues?
Looking at the complete workflow helps leaders identify systemic issues instead of isolated symptoms.
Improving the flow of work often delivers greater benefits than simply increasing engineering capacity.
Identifying Bottlenecks with Engineering Analytics
Every software organization experiences bottlenecks. The challenge is identifying them before they significantly affect delivery.
Engineering analytics provides visibility into areas where work slows or accumulates.
Common bottlenecks include:
Lengthy Code Reviews
If pull requests remain open for several days before review, developers spend more time waiting than building.
Analytics can reveal:
- Average review time
- Review backlog trends
- Teams with unusually long review cycles
- Large pull requests that consistently delay approvals
Leaders may respond by encouraging smaller pull requests, adjusting reviewer assignments, or improving review guidelines.
Slow Build and Test Pipelines
Long build times reduce developer productivity by increasing idle time between code changes and feedback.
Engineering analytics can identify:
- Pipeline duration
- Frequently failing tests
- Infrastructure slowdowns
- Stages that consume the most time
Organizations often improve delivery speed by optimizing automation rather than asking developers to work faster.
Deployment Delays
Analytics may show that completed work waits days or even weeks before reaching production.
Possible causes include:
- Manual approval processes
- Limited deployment windows
- Inadequate testing automation
- Infrastructure constraints
Addressing these issues allows teams to deliver customer value more consistently.
Measuring Improvements Instead of Making Assumptions
Elite engineering teams rarely introduce process changes without measuring their impact.
For example, suppose an organization adopts automated code quality checks.
Rather than assuming the investment improves productivity, engineering leaders monitor metrics such as:
- Lead time
- Cycle time
- Deployment frequency
- Change failure rate
- Mean time to recovery
If these indicators improve over several months, the organization gains objective evidence that the initiative delivered measurable value.
This approach encourages continuous learning rather than relying on opinions.
Using Data to Reduce Technical Debt
Technical debt often develops gradually, making it difficult to recognize until delivery begins to slow.
Engineering analytics helps identify early warning signs, including:
- Increasing build times
- Growing defect rates
- Longer onboarding periods
- Declining deployment frequency
- Rising maintenance effort
Instead of waiting for technical debt to become a major obstacle, leaders can schedule targeted improvements before productivity suffers significantly.
This proactive approach helps maintain long-term development velocity.
Balancing Speed with Software Quality
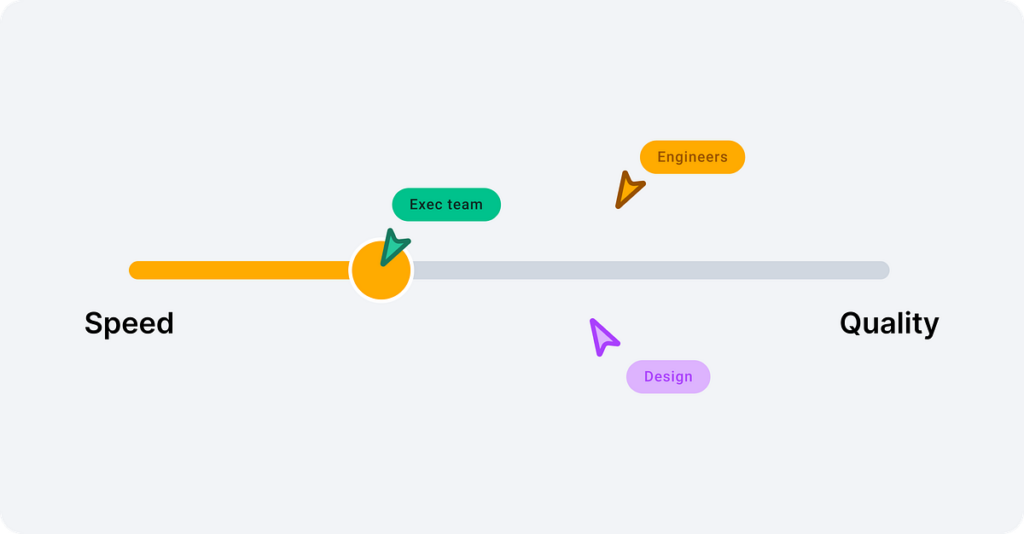
Elite engineering teams recognize that faster delivery should never come at the expense of reliability.
For this reason, they monitor both delivery and quality metrics simultaneously.
Important quality indicators include:
- Production incidents
- Failed deployments
- Rollback frequency
- Defect trends
- Mean time to recovery
When speed improves while quality remains stable—or improves as well—the organization knows its engineering practices are becoming more effective.
If delivery accelerates while failure rates increase, leaders know additional adjustments are needed.
This balanced perspective prevents short-term gains from creating long-term problems.
Improving Collaboration Through Data
Engineering analytics is not limited to technical workflows.
It also helps organizations understand how teams collaborate.
For example, leaders may discover:
- Certain repositories receive significantly slower reviews.
- Cross-functional projects experience longer delivery times.
- Knowledge is concentrated among only a few senior engineers.
- Workload distribution is uneven across teams.
These insights encourage organizational improvements such as:
- Better documentation
- Cross-team knowledge sharing
- Balanced review responsibilities
- Improved onboarding processes
The result is stronger collaboration and fewer delivery risks.
Creating Feedback Loops for Continuous Improvement
The highest-performing engineering organizations treat analytics as an ongoing feedback system rather than a reporting exercise.
A typical improvement cycle looks like this:
- Measure current performance.
- Identify a bottleneck or inefficiency.
- Implement a targeted improvement.
- Monitor relevant metrics.
- Evaluate the results.
- Repeat the process.
This continuous cycle allows organizations to make steady, evidence-based improvements without introducing unnecessary disruption.
Over time, even modest gains accumulate into significant improvements in delivery performance.
Building a Healthy Metrics Culture
Data is only valuable when teams trust how it is used.
Elite engineering organizations avoid turning analytics into a tool for evaluating individual developers.
Instead, they focus on improving systems and processes.
Healthy metrics cultures emphasize:
- Transparency about what is measured
- Shared ownership of improvements
- Open discussion of engineering challenges
- Learning from trends instead of assigning blame
- Continuous experimentation
When developers understand that analytics exists to remove obstacles rather than monitor behavior, they are more likely to contribute ideas and engage with improvement initiatives.
Trust transforms metrics from a source of anxiety into a catalyst for innovation.
Practical Examples of Data-Driven Improvement
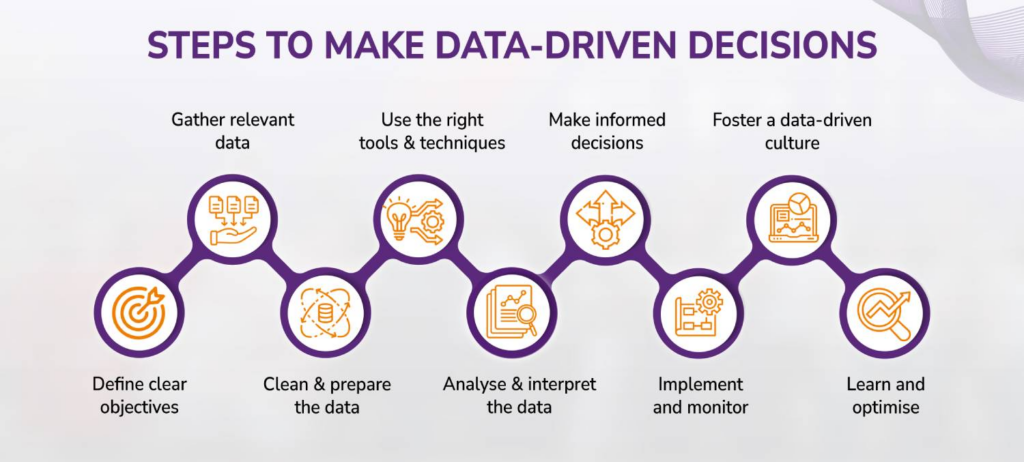
Many organizations have achieved meaningful results through relatively simple process improvements informed by engineering analytics.
Examples include:
- Reducing pull request size to shorten review times.
- Automating repetitive deployment tasks to increase release frequency.
- Improving documentation to reduce onboarding time for new engineers.
- Identifying unstable test suites and improving pipeline reliability.
- Investing in development environments to reduce setup time.
- Refactoring frequently modified components to lower maintenance effort.
None of these initiatives requires dramatic organizational change. Instead, they address specific friction points that analytics has brought to light.
Small, measurable improvements often have a greater cumulative impact than large-scale transformations.
Data as a Competitive Advantage
As software organizations grow, relying on intuition alone becomes increasingly difficult. Engineering leaders need objective insights to understand how work flows, where inefficiencies exist, and which improvements will deliver the greatest value.
Elite engineering teams use data not to measure individual productivity but to strengthen the systems that support high-quality software delivery. By identifying bottlenecks, validating process improvements, and balancing speed with reliability, they create an environment where continuous optimization becomes part of everyday engineering.
The result is more predictable delivery, healthier development workflows, stronger collaboration, and greater business value. Organizations that embrace engineering analytics as a strategic capability are better equipped to adapt, innovate, and consistently deliver exceptional software in an increasingly competitive landscape.

From Git to Business Value: Connecting Engineering Metrics to Company Goals
Engineering teams generate an enormous amount of data every day. Commits, pull requests, deployments, build times, code reviews, incident reports, and testing results all provide valuable insights into how software is developed. Yet many organizations struggle to answer a much simpler question: How does this technical data contribute to business success?
For engineering leaders, collecting metrics is only half the challenge. The real value comes from translating technical information into meaningful business outcomes that executives, product leaders, and stakeholders can understand. When engineering metrics are connected to company goals, they become powerful tools for improving decision-making, aligning teams, and demonstrating the strategic impact of software development.
The journey from Git repositories to boardroom conversations is not about replacing technical metrics—it is about putting them into the right context.
Why Technical Metrics Alone Are Not Enough
Engineering teams naturally focus on technical indicators such as:
- Number of commits
- Pull requests merged
- Deployment frequency
- Test coverage
- Build success rates
- Infrastructure performance
These metrics are valuable for improving engineering processes, but they often mean little to non-technical stakeholders.
For example, telling an executive that deployment frequency increased by 40% provides data, but not necessarily insight. Executives are more interested in understanding how that improvement affects customers, revenue, operational efficiency, or business growth.
Without this connection, engineering reports risk becoming collections of numbers rather than tools for strategic decision-making.
The Difference Between Metrics and Business KPIs
Engineering metrics measure the health of software development processes.
Business KPIs measure organizational success.
The challenge for engineering leaders is demonstrating how improvements in one influence the other.
For example:
| Engineering Metric | Business Outcome |
|---|---|
| Faster deployment frequency | Faster delivery of customer features |
| Shorter lead time | Quicker response to market opportunities |
| Lower change failure rate | Greater customer trust and reduced support costs |
| Faster incident recovery | Improved service availability and customer satisfaction |
| Reduced technical debt | Lower maintenance costs and increased innovation capacity |
When technical metrics are connected to measurable business outcomes, they become far more valuable during strategic discussions.
Start with Business Objectives
Rather than asking which engineering metrics should be reported, successful organizations begin by identifying the company’s primary objectives.
Common business goals include:
- Increasing customer satisfaction
- Accelerating product delivery
- Improving operational efficiency
- Reducing costs
- Growing revenue
- Expanding into new markets
- Increasing product reliability
Once these priorities are clear, engineering leaders can identify the metrics that best demonstrate progress toward each objective.
This approach ensures that engineering reporting supports broader organizational strategy rather than existing in isolation.
Connecting Delivery Metrics to Business Value
Delivery metrics are among the easiest technical measurements to translate into executive language.
Lead Time
Lead time measures how quickly ideas become customer-facing features.
For executives, shorter lead times mean:
- Faster product innovation
- Quicker customer feedback
- Improved competitiveness
- Greater responsiveness to market changes
Instead of reporting that lead time decreased from 14 days to 8 days, engineering leaders can explain that the organization now delivers customer-requested improvements nearly twice as quickly.
Deployment Frequency
Frequent deployments indicate a mature and efficient software delivery process.
From a business perspective, this enables:
- Faster feature releases
- Reduced release risk
- More predictable product roadmaps
- Shorter time-to-market
Executives are less interested in the number of deployments than in the increased agility those deployments provide.
Demonstrating the Value of Software Quality
Quality metrics directly influence customer experience and operational performance.
Important engineering indicators include:
- Change failure rate
- Production incidents
- Rollback frequency
- Mean time to recovery
- Defect trends
These metrics translate into business benefits such as:
- Higher customer satisfaction
- Improved platform reliability
- Lower support costs
- Reduced operational disruptions
- Stronger brand reputation
For example, reducing production incidents by 30% is not merely an engineering success—it also decreases customer frustration and minimizes revenue lost to service interruptions.
Showing the Business Impact of Developer Experience
Developer Experience is often viewed as an internal engineering concern, but its effects extend throughout the organization.
Improvements such as:
- Faster development environment setup
- Better documentation
- Automated testing
- Reliable deployment pipelines
- Improved internal tooling
can lead to measurable business outcomes including:
- Faster product delivery
- Lower onboarding costs
- Improved engineering retention
- Reduced operational overhead
- Increased development capacity
Executives may not need every technical detail, but they do care about how these improvements accelerate business performance.
Measuring Engineering Efficiency Without Oversimplifying
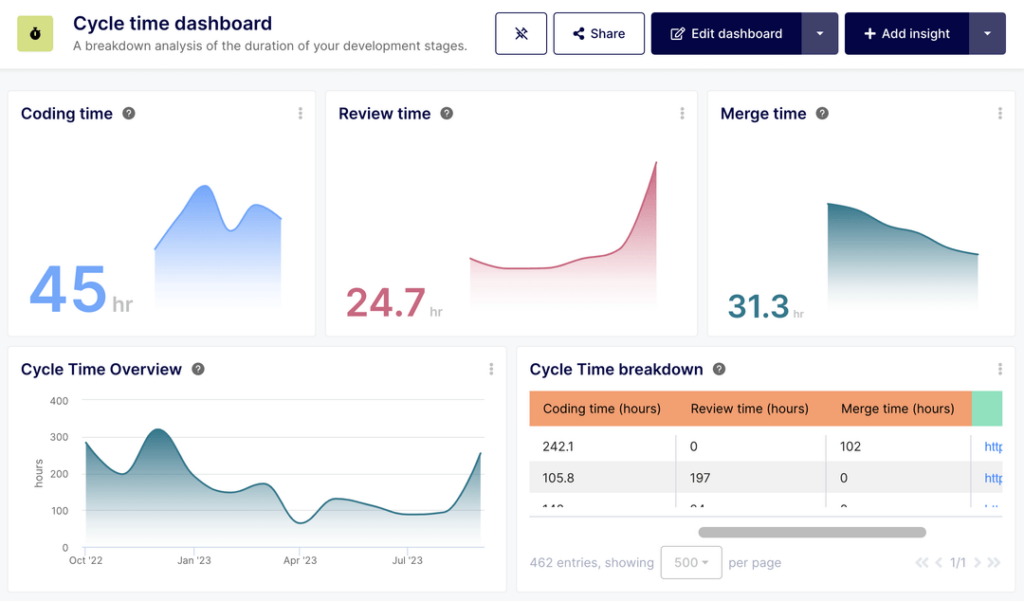
One common mistake is trying to reduce engineering productivity to a single number.
Software development is too complex for one metric to accurately represent performance.
Instead, engineering leaders should present a balanced set of complementary KPIs that reflect multiple dimensions of engineering effectiveness.
These often include:
- Delivery speed
- Software quality
- Operational stability
- Team health
- Customer impact
Looking at trends across these areas provides a much clearer picture than any single statistic.
Balanced metrics also reduce the risk of teams optimizing for one number while unintentionally harming another.
Building Executive-Friendly Dashboards
Executives generally want concise, actionable information rather than detailed engineering reports.
Effective dashboards focus on:
- Key trends over time
- Business outcomes
- Progress toward strategic goals
- Areas requiring leadership attention
- Significant improvements or emerging risks
Instead of displaying dozens of technical charts, successful engineering leaders summarize the story behind the data.
For example:
- Feature delivery accelerated by 25%.
- Production incidents declined for the third consecutive quarter.
- Deployment automation reduced release delays.
- Faster onboarding increased engineering capacity.
This narrative makes technical achievements easier to understand and more relevant to business stakeholders.
Encouraging Better Cross-Functional Collaboration
Connecting engineering metrics to business goals also improves communication between departments.
When product managers, engineering leaders, finance teams, and executives use shared KPIs, discussions become more productive.
Rather than debating technical details, teams can collaborate around common objectives such as:
- Faster customer value
- Higher product quality
- More predictable delivery
- Better operational efficiency
- Sustainable business growth
Shared metrics create alignment across the organization and reduce misunderstandings between technical and non-technical teams.
Avoiding Common Reporting Mistakes
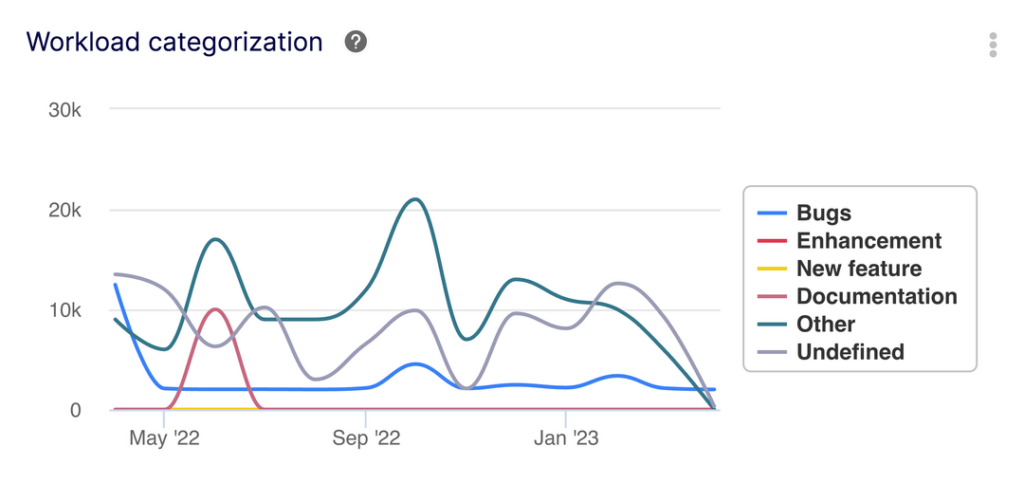
Even well-designed engineering metrics can lose their value if they are presented incorrectly.
Common pitfalls include:
Reporting Too Many Metrics
Large dashboards filled with dozens of indicators often overwhelm stakeholders instead of informing them.
Focus on the metrics that directly support business priorities.
Ignoring Context
Metrics should always include explanations.
For example, a temporary decrease in deployment frequency may result from a major architectural upgrade that improves long-term scalability.
Without context, stakeholders may draw incorrect conclusions.
Measuring Activity Instead of Outcomes
Statistics such as commit counts or lines of code rarely communicate business value.
Outcome-based metrics provide far more meaningful insights.
Making Engineering a Strategic Business Partner
Modern engineering organizations are no longer viewed solely as technical support functions. They play a central role in innovation, customer experience, operational resilience, and business growth. To demonstrate this value, engineering leaders must move beyond reporting technical activity and show how engineering performance influences company objectives.
By translating engineering metrics into business KPIs, leaders help executives understand the tangible impact of software development. Faster delivery becomes quicker time-to-market. Better reliability becomes stronger customer trust. Investments in automation become improved operational efficiency. Technical debt reduction becomes greater capacity for innovation.
When engineering data is presented in the language of business outcomes, it becomes far more than a collection of technical statistics. It becomes a strategic asset that strengthens decision-making, improves cross-functional alignment, and reinforces engineering’s role as a key driver of long-term organizational success.

How AI Is Changing Engineering Management
Artificial intelligence is transforming software development at an unprecedented pace. While much of the conversation has focused on AI-assisted coding, code generation, and automated testing, another major shift is happening behind the scenes: AI is redefining engineering management.
Today’s engineering leaders oversee increasingly complex organizations with distributed teams, multiple products, rapid release cycles, and growing expectations from the business. Keeping track of delivery progress, team health, technical risks, and operational performance has become more challenging than ever.
AI is helping engineering managers move beyond manual reporting and reactive decision-making. By analyzing engineering data at scale, identifying patterns, and surfacing actionable insights, AI enables leaders to make faster, more informed decisions without increasing oversight or micromanagement.
Rather than replacing engineering leadership, AI is becoming a powerful tool that enhances it.
Why Engineering Management Needs AI
Modern engineering organizations generate vast amounts of data every day.
Every commit, pull request, deployment, build, test run, incident, and project update contributes valuable information about how software is being developed. However, manually reviewing this data is neither practical nor scalable.
Engineering managers often face questions such as:
- Which projects are at risk of missing deadlines?
- Where are development bottlenecks forming?
- Which teams need additional support?
- Is software quality improving or declining?
- Are engineering investments producing measurable results?
Without AI, answering these questions often requires multiple dashboards, manual reports, and extensive meetings.
AI can process large volumes of engineering data in seconds, allowing leaders to focus on solving problems instead of collecting information.
Detecting Delivery Risks Before They Become Problems
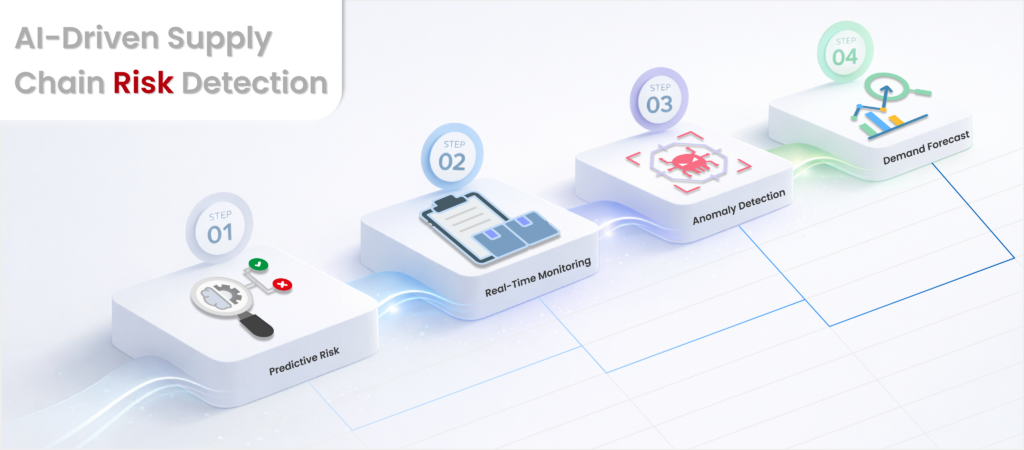
One of AI’s most valuable contributions is its ability to identify risks early.
Instead of waiting until deadlines are missed or releases fail, AI can recognize patterns that often precede delivery issues.
For example, AI may detect:
- Growing pull request backlogs
- Increasing cycle times
- Declining deployment frequency
- Repeated build failures
- Unusually large feature branches
- Rising technical debt indicators
Rather than simply reporting historical data, AI helps engineering leaders anticipate potential challenges and take action before they affect customers or business objectives.
This proactive approach reduces firefighting and improves delivery predictability.
Identifying Workflow Bottlenecks
Engineering teams frequently lose productivity due to hidden workflow inefficiencies.
AI can analyze development pipelines to identify where work consistently slows down.
Common bottlenecks include:
- Delayed code reviews
- Slow testing pipelines
- Manual deployment approvals
- Long-lived branches
- Uneven workload distribution
- Repeated infrastructure failures
Instead of relying on anecdotal feedback, managers receive data-driven recommendations about which processes deserve attention.
Small workflow improvements identified by AI can significantly increase overall delivery speed across an organization.
Summarizing Engineering Trends Automatically
Engineering leaders often spend considerable time reviewing dashboards, preparing reports, and communicating project status to executives.
AI can automate much of this work.
Rather than presenting raw metrics, AI generates concise summaries that highlight:
- Delivery improvements
- Emerging risks
- Quality trends
- Incident patterns
- Changes in deployment performance
- Areas requiring leadership attention
For example, instead of reviewing dozens of charts, a manager might receive a summary stating:
- Lead time improved by 18% this month.
- Code review delays increased in two engineering teams.
- Production stability remained consistent despite more frequent deployments.
- Testing automation reduced deployment failures.
These summaries allow leaders to focus on strategic decisions rather than assembling reports.
Helping Prioritize Engineering Investments

Engineering organizations constantly face competing priorities.
Should they:
- Hire additional engineers?
- Improve internal tooling?
- Invest in platform engineering?
- Reduce technical debt?
- Expand automation?
- Modernize infrastructure?
AI supports these decisions by identifying which investments are likely to deliver the greatest operational impact.
For instance, analysis may reveal that developers spend more time waiting for slow build pipelines than writing code. In that case, investing in faster infrastructure could improve productivity more than expanding the engineering team.
This evidence-based approach helps organizations allocate resources more effectively.
Supporting Better Team Health
Effective engineering management is about more than delivery metrics.
Healthy, motivated teams are essential for long-term success.
AI can help identify signals that may indicate organizational challenges without evaluating or ranking individual developers.
Examples include:
- Increasing review workloads
- Uneven work distribution
- Persistent delivery delays
- Growing maintenance burdens
- Rising operational interruptions
- Reduced collaboration across teams
These insights allow managers to investigate underlying causes and improve working conditions before problems contribute to burnout or turnover.
The emphasis remains on improving systems and supporting teams—not monitoring individual performance.
Improving Executive Communication
Engineering leaders frequently need to explain technical performance to executives who may not have engineering backgrounds.
AI can translate complex engineering metrics into business-focused insights.
Instead of presenting detailed technical dashboards, leaders can communicate outcomes such as:
- Faster customer feature delivery
- Improved platform reliability
- Reduced operational costs
- Increased release predictability
- Better engineering efficiency
- Lower production risk
This translation helps align engineering initiatives with company goals and enables more productive conversations across departments.
AI as a Decision Support Tool
One of the most important aspects of AI in engineering management is understanding its role.
AI should support decisions—not make them independently.
Engineering leaders still provide the context that AI cannot fully understand, including:
- Business priorities
- Customer expectations
- Team dynamics
- Organizational culture
- Long-term strategic objectives
AI excels at identifying patterns, summarizing information, and highlighting anomalies. Human leaders remain responsible for interpreting those insights and deciding how to act.
The strongest results come from combining AI-powered analysis with human judgment and experience.
Challenges to Consider
While AI offers significant advantages, organizations should approach implementation thoughtfully.
Several challenges deserve attention.
Data Quality
AI recommendations are only as reliable as the data they analyze.
Incomplete, inconsistent, or outdated engineering data can lead to misleading conclusions.
Maintaining accurate development metrics remains essential.
Avoiding Metric Obsession
AI can generate an enormous number of insights, but not every trend requires immediate action.
Leaders should focus on metrics that align with business goals rather than reacting to every fluctuation.
Preserving Trust
Developers may worry that AI is being used to monitor individual productivity.
Successful organizations communicate clearly that AI exists to improve workflows, identify systemic issues, and support better decision-making—not to evaluate employees based on activity metrics.
Transparency is critical to maintaining trust and encouraging adoption.
The Future of AI in Engineering Leadership

As AI continues to evolve, engineering management will become increasingly proactive rather than reactive. Instead of spending valuable time gathering information from multiple tools, leaders will receive intelligent recommendations that highlight risks, explain trends, and suggest opportunities for improvement.
Future AI capabilities are likely to include more accurate delivery forecasting, deeper analysis of engineering workflows, automated identification of recurring operational issues, and increasingly personalized recommendations for improving development processes. Rather than replacing experienced managers, these tools will reduce administrative overhead and provide clearer visibility into complex engineering organizations.
The result will be leaders who spend less time compiling reports and more time mentoring teams, improving engineering systems, and driving strategic initiatives.
Building Smarter Engineering Organizations
Artificial intelligence is changing engineering management by making organizational data more accessible, actionable, and meaningful. Instead of relying solely on intuition or manual reporting, engineering leaders can use AI to detect risks earlier, identify workflow bottlenecks, summarize delivery trends, and connect technical performance with business outcomes.
The greatest value of AI lies not in automating leadership but in enhancing it. By combining data-driven insights with human expertise, organizations can make better decisions, improve software delivery, strengthen collaboration, and create healthier engineering environments.
As engineering teams continue to grow in size and complexity, AI will become an increasingly valuable partner for leaders seeking to build resilient, efficient, and high-performing software organizations.
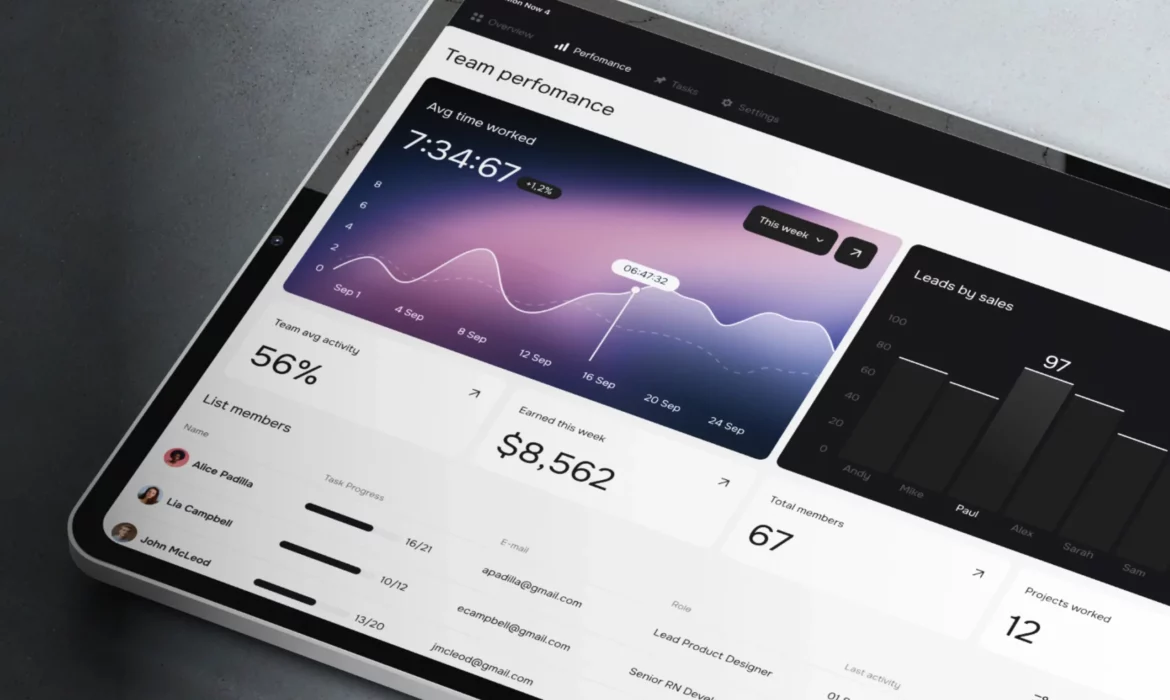
The Future of CTO Dashboards
Technology leaders have never had access to more engineering data than they do today. Every commit, deployment, pull request, incident, and production event generates valuable information about how software is built and delivered. Yet despite this abundance of data, many CTOs still struggle to answer a fundamental question: Is the engineering organization operating effectively?
Traditional dashboards often overwhelm executives with technical details while failing to provide meaningful insights into organizational performance. Charts showing commit counts, ticket closures, or server metrics may be useful for engineering teams, but they rarely help technology leaders make strategic decisions.
The future of CTO dashboards lies in transforming technical data into a clear, executive-level view of engineering productivity, software quality, delivery health, and business impact. Rather than displaying every available metric, modern dashboards should surface the information that enables faster, more informed leadership decisions.
Why Traditional Engineering Dashboards Fall Short
Many engineering dashboards were originally designed for developers and operational teams.
As a result, they often emphasize technical activity rather than organizational outcomes.
Common examples include:
- Number of commits
- Pull requests merged
- Open issues
- Build status
- Infrastructure utilization
- Repository statistics
While these metrics are valuable within engineering teams, they provide limited insight into broader questions such as:
- Are engineering investments improving delivery?
- Is software quality becoming more reliable?
- Which teams need additional support?
- Are customers receiving value faster?
- What risks require executive attention?
A CTO dashboard should answer strategic questions, not simply report operational data.
Start with Business Outcomes

An effective executive dashboard begins with the organization’s strategic objectives rather than its technical metrics.
Typical business priorities include:
- Faster product delivery
- Improved customer experience
- Higher platform reliability
- Operational efficiency
- Sustainable engineering growth
- Better resource allocation
Engineering metrics should support these objectives by showing how software development contributes to measurable business results.
This alignment allows CTOs to communicate engineering performance in terms that executives and board members understand.
Measuring Delivery Health
Delivery health provides insight into how efficiently engineering teams transform ideas into customer-facing software.
A modern CTO dashboard should include metrics such as:
Lead Time
Lead time measures how quickly work moves from request to production.
Improving lead time indicates:
- Faster customer value
- Better development workflows
- Increased organizational agility
Deployment Frequency
Frequent deployments demonstrate mature engineering practices and a reliable delivery pipeline.
Higher deployment frequency often enables:
- Smaller releases
- Reduced deployment risk
- Faster customer feedback
Cycle Time
Cycle time highlights how efficiently active development progresses through coding, review, testing, and deployment.
Longer cycle times often reveal workflow bottlenecks that deserve leadership attention.
Together, these metrics provide a comprehensive picture of delivery performance.
Monitoring Software Quality
Speed alone does not determine engineering success.
Executive dashboards should balance delivery metrics with indicators of software quality.
Key measurements include:
- Change failure rate
- Production incidents
- Rollback frequency
- Mean time to recovery
- Defect trends
Monitoring these metrics helps CTOs understand whether increased delivery velocity is being achieved without compromising reliability.
Healthy organizations improve both speed and quality over time.
Visibility into Engineering Productivity
Productivity should never be measured by counting lines of code or individual developer activity.
Instead, executive dashboards should focus on organizational effectiveness.
Useful indicators include:
- Work completed versus work planned
- Delivery predictability
- Development workflow efficiency
- Pull request review turnaround
- Build pipeline performance
- Automation coverage
These metrics provide visibility into how effectively engineering systems support software development.
The objective is to improve processes rather than monitor individuals.
Tracking Technical Debt
Technical debt is one of the most significant long-term risks facing software organizations.
Unfortunately, it often remains invisible until it begins affecting delivery speed and software quality.
Executive dashboards should include indicators such as:
- Aging dependencies
- Infrastructure modernization progress
- Refactoring initiatives
- Maintenance workload
- Code complexity trends
- Test automation coverage
Monitoring technical debt allows leadership to make informed investment decisions before problems become critical.
Measuring Developer Experience
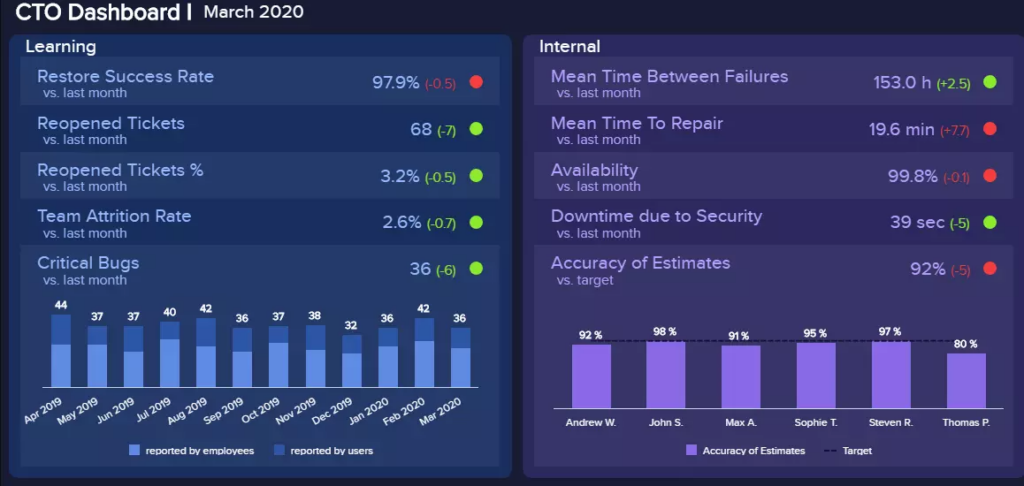
Developer Experience has become an increasingly important driver of engineering performance.
A strong DevEx improves productivity, software quality, and employee retention.
Relevant dashboard indicators may include:
- Development environment setup time
- Build duration
- Deployment success rates
- Documentation quality
- Internal platform adoption
- Developer satisfaction trends
These measurements help CTOs understand whether engineering teams have the tools and workflows needed to perform efficiently.
Investing in Developer Experience often delivers organization-wide productivity gains.
Highlighting Operational Risk
One of the most valuable functions of an executive dashboard is identifying emerging risks before they affect customers or business operations.
Rather than requiring CTOs to investigate dozens of separate reports, dashboards should surface critical warning signs automatically.
Examples include:
- Increasing incident frequency
- Slowing release velocity
- Growing review backlogs
- Declining deployment reliability
- Rising infrastructure costs
- Persistent testing failures
Early visibility enables leadership to respond proactively instead of reacting to crises.
Turning Metrics into Executive Insights
Raw numbers rarely tell the full story.
Modern CTO dashboards should prioritize trends and actionable insights over isolated statistics.
For example, instead of displaying dozens of individual charts, dashboards should summarize developments such as:
- Delivery speed improved by 20% this quarter.
- Production incidents declined following deployment automation.
- Technical debt is slowing development in one product area.
- Documentation improvements reduced onboarding time for new engineers.
- Build performance improvements increased deployment frequency.
These summaries allow CTOs to quickly understand organizational performance without spending hours interpreting data.
AI Will Make Dashboards Smarter
Artificial intelligence is beginning to transform executive engineering dashboards from passive reporting tools into intelligent decision-support systems.
Rather than simply displaying metrics, AI can:
- Detect unusual trends
- Predict delivery risks
- Identify workflow bottlenecks
- Summarize engineering performance
- Recommend process improvements
- Highlight emerging operational concerns
This allows CTOs to focus on strategic leadership instead of manually analyzing multiple data sources.
As AI capabilities mature, dashboards will become increasingly proactive, helping leaders anticipate challenges before they affect delivery or business outcomes.
Characteristics of an Effective CTO Dashboard
The most valuable executive dashboards share several common principles.
They are:
- Focused on business outcomes rather than technical activity
- Easy to understand at a glance
- Centered on trends instead of isolated numbers
- Balanced across delivery, quality, productivity, and operational health
- Designed to support strategic decision-making
- Updated continuously with reliable engineering data
Most importantly, they encourage better conversations between engineering, product, finance, and executive leadership.
The Executive View of Engineering Performance
The role of the CTO has evolved far beyond overseeing technology decisions. Today’s technology leaders are responsible for driving innovation, supporting business growth, managing operational risk, and ensuring engineering organizations deliver consistent value. Achieving these goals requires more than access to technical metrics—it requires clear, actionable visibility into the overall health of engineering.
The future of CTO dashboards is not about displaying more data. It is about presenting the right data in a way that connects engineering performance to business outcomes. By combining insights into productivity, software quality, delivery health, technical debt, developer experience, and operational risk, executive dashboards become strategic tools that guide better decisions across the organization.
As software systems grow more complex and engineering teams become increasingly distributed, organizations that invest in intelligent, outcome-focused dashboards will be better equipped to improve performance, align technology with business goals, and build resilient engineering organizations capable of sustained success.

Finding Bottlenecks Before They Become Delays
In software development, delays rarely appear without warning. A missed deadline, an unstable release, or a project that suddenly falls behind often begins with smaller signals that were visible weeks earlier. A growing pull request backlog, increasing review times, repeated build failures, or a growing dependency queue may all indicate that a workflow problem is developing.
The challenge for engineering leaders is identifying these signals early enough to take action.
Modern engineering organizations are using engineering analytics to detect bottlenecks before they become delivery problems. By analyzing how work moves through development processes, teams can uncover hidden constraints, improve predictability, and continuously optimize how software is delivered.
The goal is not to monitor individual performance. It is to understand the systems that support engineering teams and remove obstacles that slow down innovation.
Why Bottlenecks Are Difficult to Detect
Software delivery is a complex process involving many interconnected stages:
- Planning and prioritization
- Development
- Code review
- Testing
- Deployment
- Production monitoring
- Maintenance
A delay in one area often creates problems elsewhere.
For example, a slow review process may cause developers to work on fewer tasks. This creates longer delivery cycles, which can delay releases and impact business goals. By the time leadership notices the missed deadline, the original bottleneck may have existed for weeks.
Traditional reporting often focuses on outcomes after they happen:
- A project missed its target date.
- A release contained too many defects.
- A team struggled to complete planned work.
Engineering analytics allows organizations to move from reactive problem-solving to proactive improvement.
Understanding Workflow Bottlenecks

A bottleneck occurs when one part of a process limits the performance of the entire system.
In engineering organizations, common bottlenecks include:
- Slow code review cycles
- Manual approval processes
- Inefficient testing workflows
- Limited infrastructure capacity
- Unclear requirements
- Dependencies between teams
- Excessive technical complexity
These constraints often remain hidden because teams adapt around them. Developers may create workarounds, delay certain tasks, or spend time on manual activities without realizing how much impact they have on overall delivery.
Analytics helps reveal these patterns.
Measure the Flow of Work, Not Just the Output
A common mistake in engineering measurement is focusing only on completed tasks or delivered features.
While output matters, understanding how work moves through the system provides deeper insights.
Important workflow metrics include:
- Lead time
- Cycle time
- Work-in-progress levels
- Queue duration
- Review turnaround time
- Deployment frequency
- Release reliability
These measurements show where work spends time waiting, where processes slow down, and where improvements can create the greatest impact.
A team may appear productive because many tasks are completed, while hidden delays continue to reduce overall efficiency. Flow-based analytics helps expose those issues.
Identifying Code Review Bottlenecks
Code reviews are one of the most common sources of engineering delays.
A healthy review process improves quality and knowledge sharing, but slow reviews can create significant delivery friction.
Engineering analytics can highlight problems such as:
- Pull requests remaining open for extended periods
- Large changes requiring multiple review cycles
- Limited reviewer availability
- Reviews concentrated among a small number of engineers
Once these patterns are visible, teams can introduce improvements such as:
- Creating clearer review expectations
- Encouraging smaller pull requests
- Improving ownership distribution
- Automating routine checks
- Reducing unnecessary approval steps
The result is faster feedback without sacrificing software quality.
Detecting Testing and Deployment Constraints
Automated testing and deployment pipelines are designed to accelerate delivery, but they can become bottlenecks themselves.
Analytics can reveal:
- Increasing build times
- Frequent pipeline failures
- Slow integration tests
- Manual deployment steps
- Environment-related delays
For example, if a test pipeline takes 45 minutes and frequently fails, developers may avoid running tests locally or delay deployments. Over time, this creates additional risk and slows the entire organization.
Improving pipeline performance can have a direct impact on delivery speed and developer productivity.
Predicting Delivery Risks Earlier
One of the biggest advantages of engineering analytics is the ability to identify warning signs before they become major issues.
Potential risk indicators include:
- Increasing cycle times
- Growing unfinished work
- Declining deployment frequency
- Rising defect rates
- Higher numbers of blocked tasks
- Increasing dependency delays
When these patterns appear, leaders can investigate the underlying causes and take corrective action.
For example:
A project showing increasing cycle times may not need additional engineers. The actual issue could be unclear requirements, inefficient approvals, or a dependency on another team.
Analytics helps leaders address root causes rather than treating symptoms.
Improving Predictability Through Data
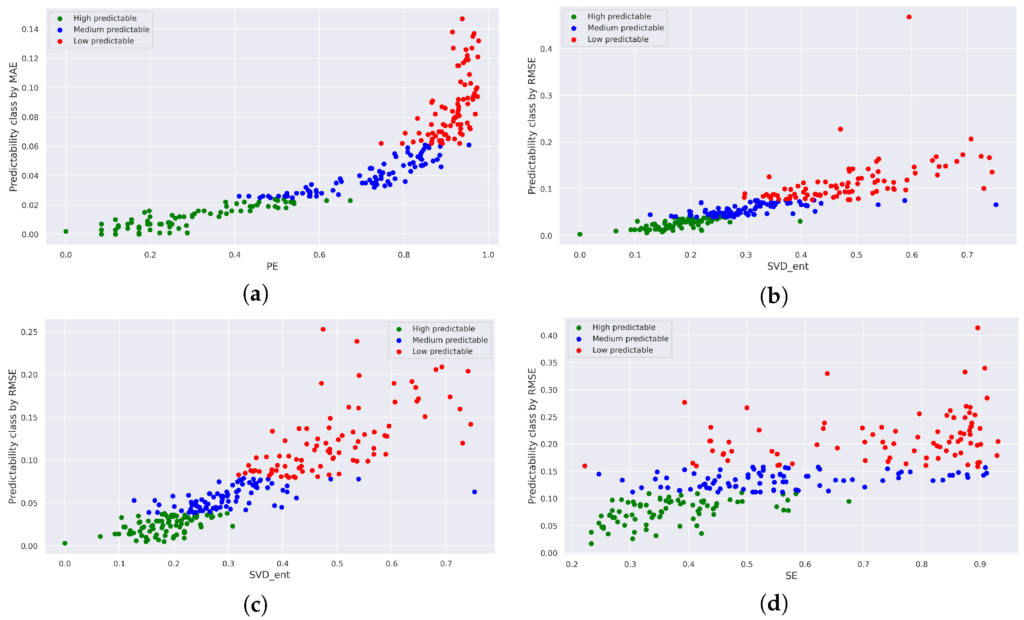
Predictable delivery is one of the most valuable outcomes of effective engineering analytics.
Organizations that understand their workflows can make more accurate forecasts because they have visibility into historical patterns.
Predictability improves when teams understand:
- How long different types of work typically take
- Where delays commonly occur
- How much work teams can realistically complete
- Which processes create uncertainty
This allows engineering leaders to set more realistic expectations with product teams, executives, and customers.
Predictability does not mean eliminating all uncertainty. It means reducing avoidable surprises.
Using Analytics to Guide Process Improvements
The most effective engineering organizations treat analytics as part of a continuous improvement cycle.
A typical approach looks like this:
- Measure current workflow performance.
- Identify recurring constraints.
- Prioritize the highest-impact bottleneck.
- Introduce a targeted improvement.
- Measure the results.
- Continue optimizing.
For example:
A team discovers that code reviews take an average of four days. They introduce smaller pull requests and clearer review ownership. After several weeks, analytics shows review time has dropped to one day.
The organization now has measurable evidence that the improvement worked.
Avoiding the Wrong Use of Engineering Analytics
While analytics can reveal valuable insights, the way metrics are used determines whether they improve or damage engineering culture.
Organizations should avoid using bottleneck analysis to:
- Rank individual developers
- Measure effort through activity counts
- Create pressure without addressing systemic issues
- Encourage teams to optimize metrics instead of outcomes
The purpose of analytics is to improve the environment where engineers work.
A delayed project is rarely caused by a single person. More often, it is the result of processes, tools, dependencies, or organizational structures that need improvement.
Building a Culture of Continuous Optimization
Finding bottlenecks is not a one-time activity. Engineering systems constantly change as teams grow, products evolve, and technologies shift.
A strong analytics culture encourages teams to regularly ask:
- Where is work slowing down?
- What creates unnecessary friction?
- Which improvements would have the greatest impact?
- Are changes producing better outcomes?
This mindset transforms engineering improvement from a reactive process into an ongoing discipline.
Teams become better at identifying problems early and adapting before small issues become major delivery challenges.
The Future of Predictable Software Delivery
Engineering analytics is changing how organizations manage software delivery. Instead of waiting for delays to appear, leaders can identify early warning signals and improve the systems that influence performance.
By analyzing workflow patterns, delivery metrics, quality indicators, and operational trends, engineering teams gain a clearer understanding of where bottlenecks exist and how to remove them.
The most successful organizations do not achieve predictable delivery by simply asking teams to work faster. They achieve it by creating better processes, improving tools, and using data to continuously optimize the way work flows.
Finding bottlenecks before they become delays is not just a productivity improvement—it is a strategic advantage that helps engineering organizations deliver higher-quality software with greater confidence and consistency.
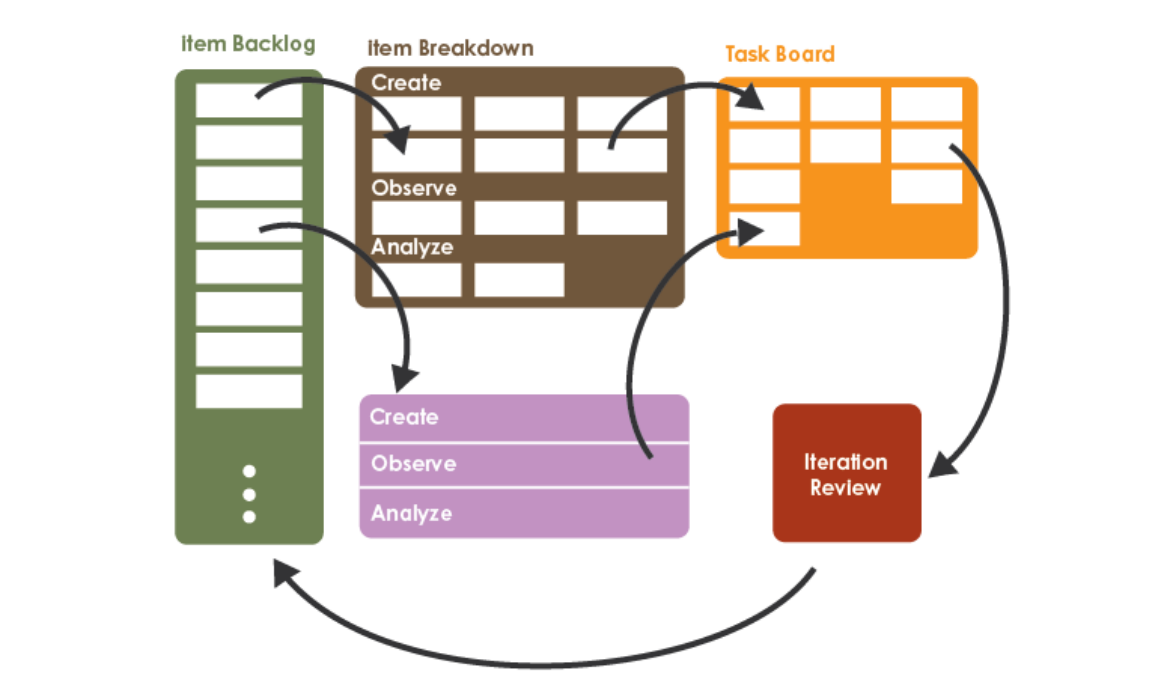
Data-Driven Sprint Retrospectives
Sprint retrospectives are one of the most valuable practices in agile software development. They create a dedicated space for teams to reflect on what went well, identify challenges, and agree on improvements for future work.
However, many retrospectives struggle to create meaningful change. Conversations often depend heavily on personal opinions, recent experiences, or the loudest voices in the room. While team feedback is essential, relying only on subjective observations can make it difficult to identify the real causes behind delivery problems.
Data-driven sprint retrospectives provide a stronger foundation by combining team insights with measurable engineering signals. By using metrics to understand delivery patterns, quality trends, and workflow challenges, teams can move from assumptions to evidence-based improvements.
The goal is not to replace human discussion with numbers. It is to give teams better information so they can have more productive conversations and make smarter decisions.
Why Traditional Retrospectives Often Fall Short
A typical retrospective asks questions such as:
- What went well?
- What did not go well?
- What should we improve?
These questions are useful, but the answers often depend on individual perception.
For example, one team member may feel that the sprint was productive because several important features were completed. Another may feel frustrated because code reviews were consistently delayed.
Both perspectives may be accurate, but without supporting data, the team may struggle to understand the larger pattern.
Common limitations of opinion-based retrospectives include:
- Focusing on recent events instead of long-term trends
- Discussing symptoms instead of root causes
- Prioritizing problems based on emotion rather than impact
- Repeating the same improvement ideas without measuring results
Engineering metrics help teams move beyond individual experiences and examine how the entire delivery system is performing.
Turning Retrospectives Into Evidence-Based Conversations
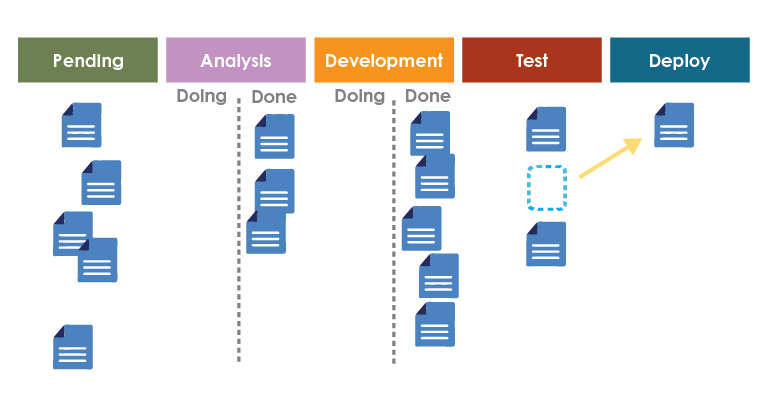
A data-driven retrospective combines qualitative feedback with objective information.
Instead of saying:
“It feels like our releases are becoming slower.”
The team can examine:
- Has cycle time increased?
- Are pull requests staying open longer?
- Is deployment frequency declining?
- Are more tasks remaining unfinished at the end of sprints?
The discussion becomes more focused because the team is working from shared evidence.
Metrics do not provide every answer, but they help teams ask better questions.
Key Metrics for Better Sprint Retrospectives
Different teams will need different measurements, but several engineering metrics provide valuable insights during retrospectives.
Delivery Metrics
Understanding how efficiently work moves through the development process helps teams identify workflow issues.
Sprint Completion Trends
Looking beyond whether a sprint goal was completed helps teams understand patterns over time.
Useful questions include:
- Are planned commitments consistently being completed?
- Are certain types of work frequently underestimated?
- Are unexpected tasks disrupting planned delivery?
The goal is not to judge whether a sprint was successful or unsuccessful. It is to understand why certain outcomes occur.
Cycle Time
Cycle time measures how long work takes from active development to completion.
Tracking cycle time helps identify:
- Slow review processes
- Testing delays
- Complex implementation work
- Dependency issues
If cycle time increases over several sprints, the team can investigate what changed and where improvements are needed.
Work in Progress
Too much work happening simultaneously can reduce efficiency.
High work-in-progress levels may indicate:
- Too many competing priorities
- Difficulty finishing tasks
- Excessive context switching
- Unclear ownership
Reducing unnecessary parallel work often improves delivery speed and focus.
Quality Metrics
Fast delivery is valuable, but not if it creates reliability problems.
Quality metrics help teams understand whether process improvements are producing sustainable results.
Important indicators include:
Defect Trends
Tracking defects over time helps identify whether quality is improving or declining.
Teams can discuss:
- Are certain types of bugs repeating?
- Are testing gaps appearing?
- Are rushed releases creating additional work?
Production Issues
Production incidents provide important learning opportunities.
Retrospectives can examine:
- What caused the issue?
- Could earlier detection have helped?
- Did existing processes support a quick recovery?
The goal is learning and prevention, not assigning blame.
Failed Deployments
Deployment failures can reveal problems with:
- Testing processes
- Release procedures
- Infrastructure reliability
- Automation quality
Analyzing these patterns helps teams make targeted improvements.
Developer Workflow Metrics
Many delivery problems originate from workflow friction.
Engineering teams can use metrics to identify obstacles such as:
- Long build times
- Slow code reviews
- Environment setup issues
- Repeated manual processes
For example, if developers spend significant time waiting for builds, the team may prioritize improving the development pipeline rather than simply trying to complete more tasks.
Improving workflows often creates productivity gains across the entire team.
Using Metrics to Find Root Causes
One of the biggest advantages of data-driven retrospectives is the ability to move beyond surface-level observations.
Consider this example:
Problem: The team missed sprint goals for three consecutive sprints.
A traditional discussion might conclude:
“We need to estimate better.”
A data-driven retrospective might reveal:
- 40% of sprint work was interrupted by production issues.
- Code review time increased by 60%.
- Several tasks depended on another team.
- Testing delays pushed completed work into the next sprint.
The actual improvement actions may involve reducing interruptions, improving collaboration, or removing dependencies—not simply changing estimates.
Data helps teams solve the right problem.
Combining Metrics With Team Context
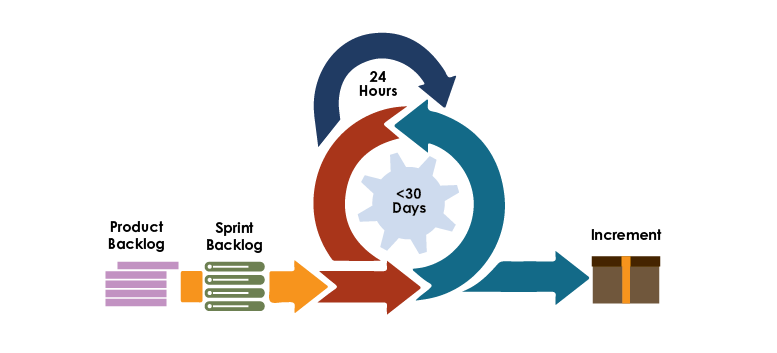
Metrics are powerful, but they should never replace human judgment.
A number alone does not explain why something happened.
For example:
A longer cycle time could indicate a problem, but it could also mean the team completed a complex architectural improvement that required more effort.
A temporary decrease in deployment frequency could represent a problem, or it could reflect a major infrastructure upgrade.
Effective retrospectives combine:
- Quantitative data
- Team experiences
- Customer feedback
- Business context
- Technical knowledge
The best decisions come from understanding both the numbers and the story behind them.
Creating Better Improvement Actions
Many retrospectives fail because improvement actions are vague.
Statements like:
- “Communicate better.”
- “Test more.”
- “Review code faster.”
are difficult to measure and easy to forget.
Data-driven teams create specific improvement goals.
Examples:
Instead of:
“Improve code reviews.”
Create:
“Reduce average pull request review time from two days to eight hours by assigning reviewers earlier and limiting large changes.”
Instead of:
“Reduce deployment problems.”
Create:
“Decrease failed deployments by improving automated testing coverage for critical services.”
Clear goals make progress measurable and create accountability.
Measuring Whether Improvements Work
A data-driven retrospective does not end when the meeting finishes.
Teams should track whether agreed improvements actually create better outcomes.
The improvement cycle looks like this:
- Identify a challenge using team feedback and metrics.
- Define a specific improvement action.
- Measure the relevant indicators.
- Review the results in future retrospectives.
- Adjust the approach if needed.
This creates a continuous learning process where teams experiment, measure, and improve.
Building a Culture of Continuous Improvement
The purpose of engineering metrics is not to create more reporting. It is to help teams understand their work and improve their ability to deliver value.
When used correctly, metrics create healthier retrospective conversations by:
- Reducing guesswork
- Highlighting hidden problems
- Encouraging collaboration
- Supporting better decisions
- Making improvements measurable
Teams become more proactive because they can identify patterns before they become serious issues.
The Future of Sprint Retrospectives
As engineering organizations become more complex, data-driven retrospectives will become an increasingly important part of high-performing development teams. Metrics provide visibility into delivery patterns, workflow constraints, and quality trends that are difficult to identify through discussion alone.
The most effective retrospectives will not choose between human insight and engineering analytics. They will combine both.
Team members provide the context, experience, and creativity needed to understand challenges. Data provides the evidence needed to prioritize improvements and measure progress.
By transforming retrospectives from opinion-based conversations into evidence-based improvement sessions, engineering teams can continuously refine their processes, remove obstacles, and build a stronger foundation for delivering reliable software faster.

