
The Future of CTO Dashboards
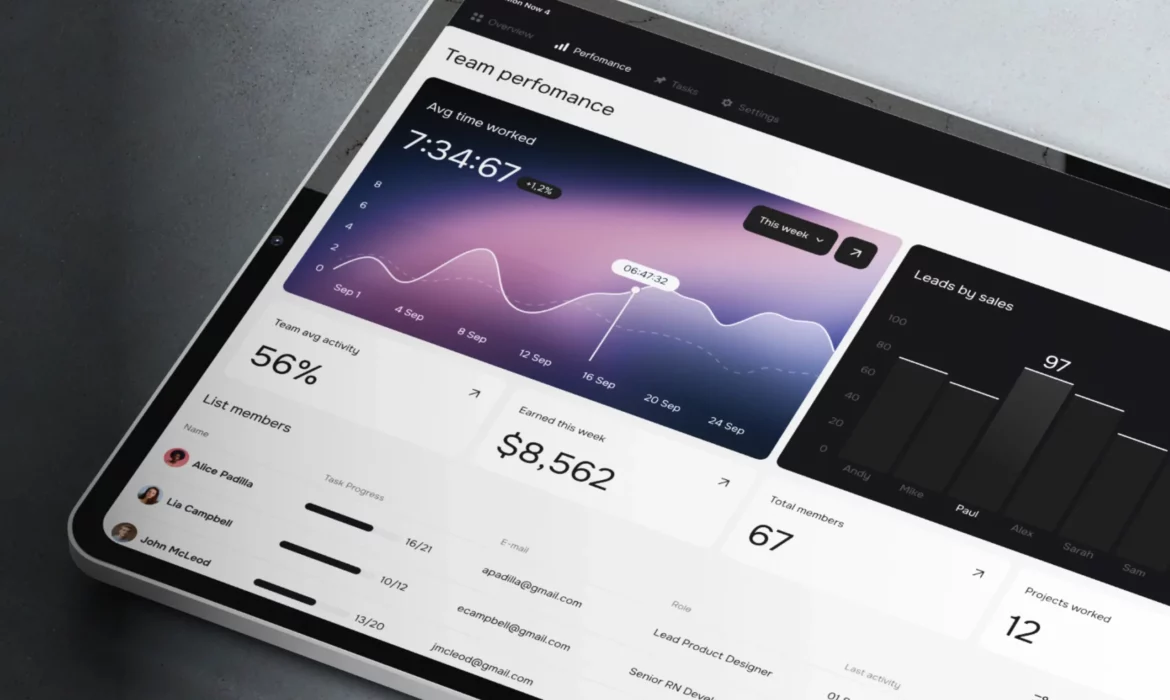
Technology leaders have never had access to more engineering data than they do today. Every commit, deployment, pull request, incident, and production event generates valuable information about how software is built and delivered. Yet despite this abundance of data, many CTOs still struggle to answer a fundamental question: Is the engineering organization operating effectively?
Traditional dashboards often overwhelm executives with technical details while failing to provide meaningful insights into organizational performance. Charts showing commit counts, ticket closures, or server metrics may be useful for engineering teams, but they rarely help technology leaders make strategic decisions.
The future of CTO dashboards lies in transforming technical data into a clear, executive-level view of engineering productivity, software quality, delivery health, and business impact. Rather than displaying every available metric, modern dashboards should surface the information that enables faster, more informed leadership decisions.
Why Traditional Engineering Dashboards Fall Short
Many engineering dashboards were originally designed for developers and operational teams.
As a result, they often emphasize technical activity rather than organizational outcomes.
Common examples include:
- Number of commits
- Pull requests merged
- Open issues
- Build status
- Infrastructure utilization
- Repository statistics
While these metrics are valuable within engineering teams, they provide limited insight into broader questions such as:
- Are engineering investments improving delivery?
- Is software quality becoming more reliable?
- Which teams need additional support?
- Are customers receiving value faster?
- What risks require executive attention?
A CTO dashboard should answer strategic questions, not simply report operational data.
Start with Business Outcomes
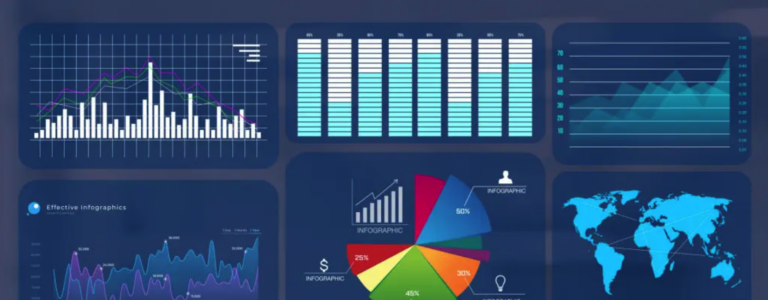
An effective executive dashboard begins with the organization’s strategic objectives rather than its technical metrics.
Typical business priorities include:
- Faster product delivery
- Improved customer experience
- Higher platform reliability
- Operational efficiency
- Sustainable engineering growth
- Better resource allocation
Engineering metrics should support these objectives by showing how software development contributes to measurable business results.
This alignment allows CTOs to communicate engineering performance in terms that executives and board members understand.
Measuring Delivery Health
Delivery health provides insight into how efficiently engineering teams transform ideas into customer-facing software.
A modern CTO dashboard should include metrics such as:
Lead Time
Lead time measures how quickly work moves from request to production.
Improving lead time indicates:
- Faster customer value
- Better development workflows
- Increased organizational agility
Deployment Frequency
Frequent deployments demonstrate mature engineering practices and a reliable delivery pipeline.
Higher deployment frequency often enables:
- Smaller releases
- Reduced deployment risk
- Faster customer feedback
Cycle Time
Cycle time highlights how efficiently active development progresses through coding, review, testing, and deployment.
Longer cycle times often reveal workflow bottlenecks that deserve leadership attention.
Together, these metrics provide a comprehensive picture of delivery performance.
Monitoring Software Quality
Speed alone does not determine engineering success.
Executive dashboards should balance delivery metrics with indicators of software quality.
Key measurements include:
- Change failure rate
- Production incidents
- Rollback frequency
- Mean time to recovery
- Defect trends
Monitoring these metrics helps CTOs understand whether increased delivery velocity is being achieved without compromising reliability.
Healthy organizations improve both speed and quality over time.
Visibility into Engineering Productivity
Productivity should never be measured by counting lines of code or individual developer activity.
Instead, executive dashboards should focus on organizational effectiveness.
Useful indicators include:
- Work completed versus work planned
- Delivery predictability
- Development workflow efficiency
- Pull request review turnaround
- Build pipeline performance
- Automation coverage
These metrics provide visibility into how effectively engineering systems support software development.
The objective is to improve processes rather than monitor individuals.
Tracking Technical Debt
Technical debt is one of the most significant long-term risks facing software organizations.
Unfortunately, it often remains invisible until it begins affecting delivery speed and software quality.
Executive dashboards should include indicators such as:
- Aging dependencies
- Infrastructure modernization progress
- Refactoring initiatives
- Maintenance workload
- Code complexity trends
- Test automation coverage
Monitoring technical debt allows leadership to make informed investment decisions before problems become critical.
Measuring Developer Experience
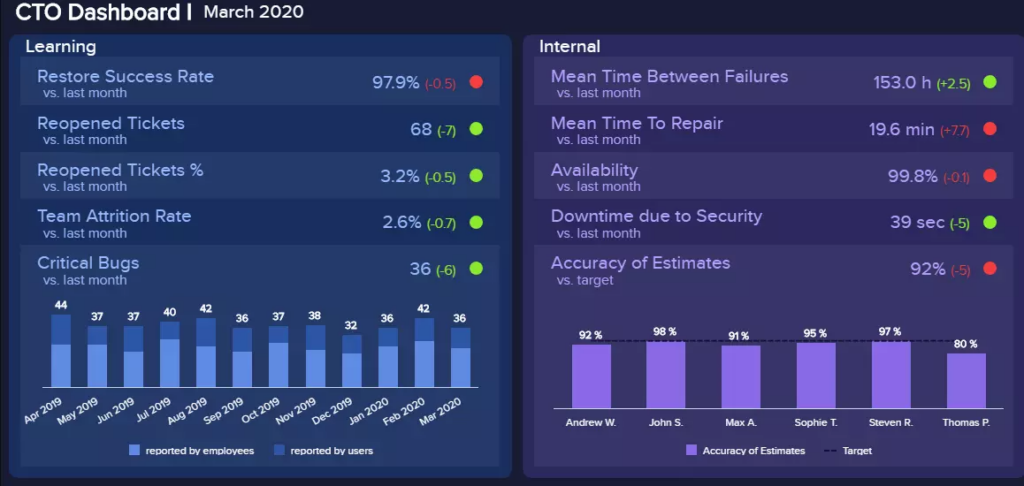
Developer Experience has become an increasingly important driver of engineering performance.
A strong DevEx improves productivity, software quality, and employee retention.
Relevant dashboard indicators may include:
- Development environment setup time
- Build duration
- Deployment success rates
- Documentation quality
- Internal platform adoption
- Developer satisfaction trends
These measurements help CTOs understand whether engineering teams have the tools and workflows needed to perform efficiently.
Investing in Developer Experience often delivers organization-wide productivity gains.
Highlighting Operational Risk
One of the most valuable functions of an executive dashboard is identifying emerging risks before they affect customers or business operations.
Rather than requiring CTOs to investigate dozens of separate reports, dashboards should surface critical warning signs automatically.
Examples include:
- Increasing incident frequency
- Slowing release velocity
- Growing review backlogs
- Declining deployment reliability
- Rising infrastructure costs
- Persistent testing failures
Early visibility enables leadership to respond proactively instead of reacting to crises.
Turning Metrics into Executive Insights
Raw numbers rarely tell the full story.
Modern CTO dashboards should prioritize trends and actionable insights over isolated statistics.
For example, instead of displaying dozens of individual charts, dashboards should summarize developments such as:
- Delivery speed improved by 20% this quarter.
- Production incidents declined following deployment automation.
- Technical debt is slowing development in one product area.
- Documentation improvements reduced onboarding time for new engineers.
- Build performance improvements increased deployment frequency.
These summaries allow CTOs to quickly understand organizational performance without spending hours interpreting data.
AI Will Make Dashboards Smarter
Artificial intelligence is beginning to transform executive engineering dashboards from passive reporting tools into intelligent decision-support systems.
Rather than simply displaying metrics, AI can:
- Detect unusual trends
- Predict delivery risks
- Identify workflow bottlenecks
- Summarize engineering performance
- Recommend process improvements
- Highlight emerging operational concerns
This allows CTOs to focus on strategic leadership instead of manually analyzing multiple data sources.
As AI capabilities mature, dashboards will become increasingly proactive, helping leaders anticipate challenges before they affect delivery or business outcomes.
Characteristics of an Effective CTO Dashboard
The most valuable executive dashboards share several common principles.
They are:
- Focused on business outcomes rather than technical activity
- Easy to understand at a glance
- Centered on trends instead of isolated numbers
- Balanced across delivery, quality, productivity, and operational health
- Designed to support strategic decision-making
- Updated continuously with reliable engineering data
Most importantly, they encourage better conversations between engineering, product, finance, and executive leadership.
The Executive View of Engineering Performance
The role of the CTO has evolved far beyond overseeing technology decisions. Today’s technology leaders are responsible for driving innovation, supporting business growth, managing operational risk, and ensuring engineering organizations deliver consistent value. Achieving these goals requires more than access to technical metrics—it requires clear, actionable visibility into the overall health of engineering.
The future of CTO dashboards is not about displaying more data. It is about presenting the right data in a way that connects engineering performance to business outcomes. By combining insights into productivity, software quality, delivery health, technical debt, developer experience, and operational risk, executive dashboards become strategic tools that guide better decisions across the organization.
As software systems grow more complex and engineering teams become increasingly distributed, organizations that invest in intelligent, outcome-focused dashboards will be better equipped to improve performance, align technology with business goals, and build resilient engineering organizations capable of sustained success.

