
From Git to Business Value: Connecting Engineering Metrics to Company Goals

Engineering teams generate an enormous amount of data every day. Commits, pull requests, deployments, build times, code reviews, incident reports, and testing results all provide valuable insights into how software is developed. Yet many organizations struggle to answer a much simpler question: How does this technical data contribute to business success?
For engineering leaders, collecting metrics is only half the challenge. The real value comes from translating technical information into meaningful business outcomes that executives, product leaders, and stakeholders can understand. When engineering metrics are connected to company goals, they become powerful tools for improving decision-making, aligning teams, and demonstrating the strategic impact of software development.
The journey from Git repositories to boardroom conversations is not about replacing technical metrics—it is about putting them into the right context.
Why Technical Metrics Alone Are Not Enough
Engineering teams naturally focus on technical indicators such as:
- Number of commits
- Pull requests merged
- Deployment frequency
- Test coverage
- Build success rates
- Infrastructure performance
These metrics are valuable for improving engineering processes, but they often mean little to non-technical stakeholders.
For example, telling an executive that deployment frequency increased by 40% provides data, but not necessarily insight. Executives are more interested in understanding how that improvement affects customers, revenue, operational efficiency, or business growth.
Without this connection, engineering reports risk becoming collections of numbers rather than tools for strategic decision-making.
The Difference Between Metrics and Business KPIs
Engineering metrics measure the health of software development processes.
Business KPIs measure organizational success.
The challenge for engineering leaders is demonstrating how improvements in one influence the other.
For example:
| Engineering Metric | Business Outcome |
|---|---|
| Faster deployment frequency | Faster delivery of customer features |
| Shorter lead time | Quicker response to market opportunities |
| Lower change failure rate | Greater customer trust and reduced support costs |
| Faster incident recovery | Improved service availability and customer satisfaction |
| Reduced technical debt | Lower maintenance costs and increased innovation capacity |
When technical metrics are connected to measurable business outcomes, they become far more valuable during strategic discussions.
Start with Business Objectives
Rather than asking which engineering metrics should be reported, successful organizations begin by identifying the company’s primary objectives.
Common business goals include:
- Increasing customer satisfaction
- Accelerating product delivery
- Improving operational efficiency
- Reducing costs
- Growing revenue
- Expanding into new markets
- Increasing product reliability
Once these priorities are clear, engineering leaders can identify the metrics that best demonstrate progress toward each objective.
This approach ensures that engineering reporting supports broader organizational strategy rather than existing in isolation.
Connecting Delivery Metrics to Business Value
Delivery metrics are among the easiest technical measurements to translate into executive language.
Lead Time
Lead time measures how quickly ideas become customer-facing features.
For executives, shorter lead times mean:
- Faster product innovation
- Quicker customer feedback
- Improved competitiveness
- Greater responsiveness to market changes
Instead of reporting that lead time decreased from 14 days to 8 days, engineering leaders can explain that the organization now delivers customer-requested improvements nearly twice as quickly.
Deployment Frequency
Frequent deployments indicate a mature and efficient software delivery process.
From a business perspective, this enables:
- Faster feature releases
- Reduced release risk
- More predictable product roadmaps
- Shorter time-to-market
Executives are less interested in the number of deployments than in the increased agility those deployments provide.
Demonstrating the Value of Software Quality
Quality metrics directly influence customer experience and operational performance.
Important engineering indicators include:
- Change failure rate
- Production incidents
- Rollback frequency
- Mean time to recovery
- Defect trends
These metrics translate into business benefits such as:
- Higher customer satisfaction
- Improved platform reliability
- Lower support costs
- Reduced operational disruptions
- Stronger brand reputation
For example, reducing production incidents by 30% is not merely an engineering success—it also decreases customer frustration and minimizes revenue lost to service interruptions.
Showing the Business Impact of Developer Experience
Developer Experience is often viewed as an internal engineering concern, but its effects extend throughout the organization.
Improvements such as:
- Faster development environment setup
- Better documentation
- Automated testing
- Reliable deployment pipelines
- Improved internal tooling
can lead to measurable business outcomes including:
- Faster product delivery
- Lower onboarding costs
- Improved engineering retention
- Reduced operational overhead
- Increased development capacity
Executives may not need every technical detail, but they do care about how these improvements accelerate business performance.
Measuring Engineering Efficiency Without Oversimplifying
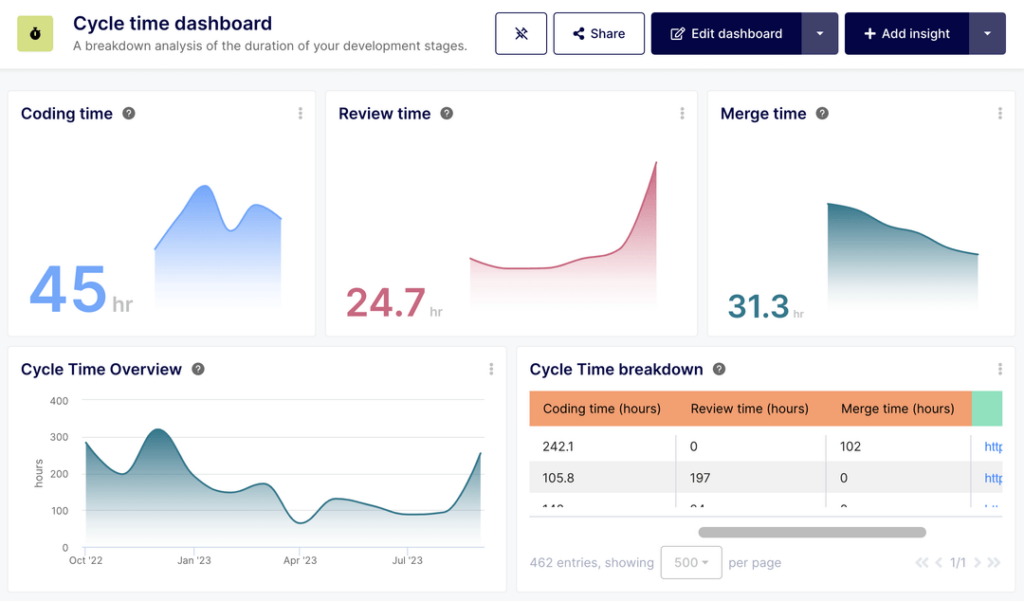
One common mistake is trying to reduce engineering productivity to a single number.
Software development is too complex for one metric to accurately represent performance.
Instead, engineering leaders should present a balanced set of complementary KPIs that reflect multiple dimensions of engineering effectiveness.
These often include:
- Delivery speed
- Software quality
- Operational stability
- Team health
- Customer impact
Looking at trends across these areas provides a much clearer picture than any single statistic.
Balanced metrics also reduce the risk of teams optimizing for one number while unintentionally harming another.
Building Executive-Friendly Dashboards
Executives generally want concise, actionable information rather than detailed engineering reports.
Effective dashboards focus on:
- Key trends over time
- Business outcomes
- Progress toward strategic goals
- Areas requiring leadership attention
- Significant improvements or emerging risks
Instead of displaying dozens of technical charts, successful engineering leaders summarize the story behind the data.
For example:
- Feature delivery accelerated by 25%.
- Production incidents declined for the third consecutive quarter.
- Deployment automation reduced release delays.
- Faster onboarding increased engineering capacity.
This narrative makes technical achievements easier to understand and more relevant to business stakeholders.
Encouraging Better Cross-Functional Collaboration
Connecting engineering metrics to business goals also improves communication between departments.
When product managers, engineering leaders, finance teams, and executives use shared KPIs, discussions become more productive.
Rather than debating technical details, teams can collaborate around common objectives such as:
- Faster customer value
- Higher product quality
- More predictable delivery
- Better operational efficiency
- Sustainable business growth
Shared metrics create alignment across the organization and reduce misunderstandings between technical and non-technical teams.
Avoiding Common Reporting Mistakes
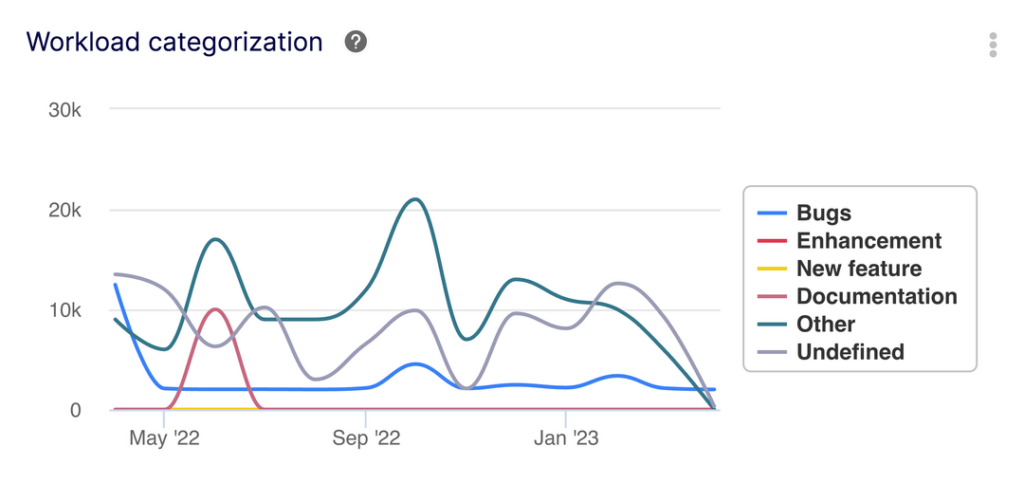
Even well-designed engineering metrics can lose their value if they are presented incorrectly.
Common pitfalls include:
Reporting Too Many Metrics
Large dashboards filled with dozens of indicators often overwhelm stakeholders instead of informing them.
Focus on the metrics that directly support business priorities.
Ignoring Context
Metrics should always include explanations.
For example, a temporary decrease in deployment frequency may result from a major architectural upgrade that improves long-term scalability.
Without context, stakeholders may draw incorrect conclusions.
Measuring Activity Instead of Outcomes
Statistics such as commit counts or lines of code rarely communicate business value.
Outcome-based metrics provide far more meaningful insights.
Making Engineering a Strategic Business Partner
Modern engineering organizations are no longer viewed solely as technical support functions. They play a central role in innovation, customer experience, operational resilience, and business growth. To demonstrate this value, engineering leaders must move beyond reporting technical activity and show how engineering performance influences company objectives.
By translating engineering metrics into business KPIs, leaders help executives understand the tangible impact of software development. Faster delivery becomes quicker time-to-market. Better reliability becomes stronger customer trust. Investments in automation become improved operational efficiency. Technical debt reduction becomes greater capacity for innovation.
When engineering data is presented in the language of business outcomes, it becomes far more than a collection of technical statistics. It becomes a strategic asset that strengthens decision-making, improves cross-functional alignment, and reinforces engineering’s role as a key driver of long-term organizational success.

