
How Elite Engineering Teams Use Data to Improve Delivery
Building high-performing software teams is about more than hiring talented engineers or adopting the latest technologies. The most successful engineering organizations consistently deliver reliable software because they understand how work flows through their development process and use data to improve it over time.
Rather than relying on assumptions or reacting to problems after they occur, elite engineering teams use engineering analytics to uncover bottlenecks, measure the impact of process changes, and make informed decisions. Their focus is not on monitoring developers but on optimizing the systems that enable great work.
By turning engineering data into actionable insights, these teams improve delivery speed, maintain software quality, and create a culture of continuous improvement.
Why Data Matters in Modern Engineering
Software development involves hundreds of interconnected activities, from planning and coding to testing, reviewing, deploying, and maintaining applications.
Without visibility into these workflows, engineering leaders often struggle to answer important questions, such as:
- Why are releases taking longer than expected?
- Where do projects consistently slow down?
- Which processes create unnecessary delays?
- Is technical debt affecting delivery speed?
- Are engineering improvements producing measurable results?
Instead of relying on intuition, elite engineering teams use data to identify patterns, validate assumptions, and prioritize improvements based on evidence.
This approach enables smarter decision-making while reducing guesswork.
Focus on the Flow of Work

High-performing engineering organizations understand that productivity depends on how efficiently work moves through the development pipeline.
Rather than measuring individual output, they analyze the entire delivery process.
Key questions include:
- How long does work wait before development begins?
- How quickly are pull requests reviewed?
- Where do deployments become delayed?
- Which approval steps add unnecessary complexity?
- How often are releases interrupted by production issues?
Looking at the complete workflow helps leaders identify systemic issues instead of isolated symptoms.
Improving the flow of work often delivers greater benefits than simply increasing engineering capacity.
Identifying Bottlenecks with Engineering Analytics
Every software organization experiences bottlenecks. The challenge is identifying them before they significantly affect delivery.
Engineering analytics provides visibility into areas where work slows or accumulates.
Common bottlenecks include:
Lengthy Code Reviews
If pull requests remain open for several days before review, developers spend more time waiting than building.
Analytics can reveal:
- Average review time
- Review backlog trends
- Teams with unusually long review cycles
- Large pull requests that consistently delay approvals
Leaders may respond by encouraging smaller pull requests, adjusting reviewer assignments, or improving review guidelines.
Slow Build and Test Pipelines
Long build times reduce developer productivity by increasing idle time between code changes and feedback.
Engineering analytics can identify:
- Pipeline duration
- Frequently failing tests
- Infrastructure slowdowns
- Stages that consume the most time
Organizations often improve delivery speed by optimizing automation rather than asking developers to work faster.
Deployment Delays
Analytics may show that completed work waits days or even weeks before reaching production.
Possible causes include:
- Manual approval processes
- Limited deployment windows
- Inadequate testing automation
- Infrastructure constraints
Addressing these issues allows teams to deliver customer value more consistently.
Measuring Improvements Instead of Making Assumptions
Elite engineering teams rarely introduce process changes without measuring their impact.
For example, suppose an organization adopts automated code quality checks.
Rather than assuming the investment improves productivity, engineering leaders monitor metrics such as:
- Lead time
- Cycle time
- Deployment frequency
- Change failure rate
- Mean time to recovery
If these indicators improve over several months, the organization gains objective evidence that the initiative delivered measurable value.
This approach encourages continuous learning rather than relying on opinions.
Using Data to Reduce Technical Debt
Technical debt often develops gradually, making it difficult to recognize until delivery begins to slow.
Engineering analytics helps identify early warning signs, including:
- Increasing build times
- Growing defect rates
- Longer onboarding periods
- Declining deployment frequency
- Rising maintenance effort
Instead of waiting for technical debt to become a major obstacle, leaders can schedule targeted improvements before productivity suffers significantly.
This proactive approach helps maintain long-term development velocity.
Balancing Speed with Software Quality
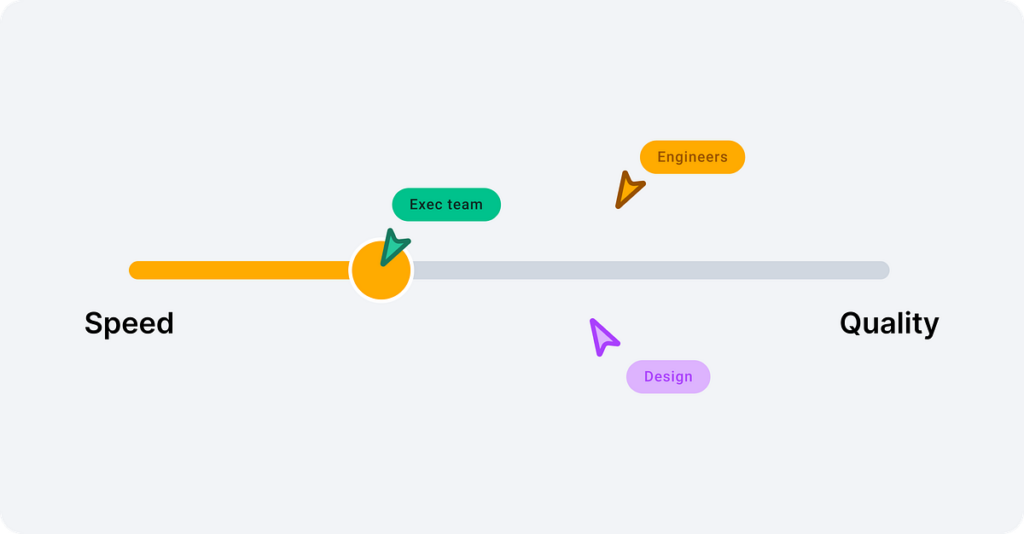
Elite engineering teams recognize that faster delivery should never come at the expense of reliability.
For this reason, they monitor both delivery and quality metrics simultaneously.
Important quality indicators include:
- Production incidents
- Failed deployments
- Rollback frequency
- Defect trends
- Mean time to recovery
When speed improves while quality remains stable—or improves as well—the organization knows its engineering practices are becoming more effective.
If delivery accelerates while failure rates increase, leaders know additional adjustments are needed.
This balanced perspective prevents short-term gains from creating long-term problems.
Improving Collaboration Through Data
Engineering analytics is not limited to technical workflows.
It also helps organizations understand how teams collaborate.
For example, leaders may discover:
- Certain repositories receive significantly slower reviews.
- Cross-functional projects experience longer delivery times.
- Knowledge is concentrated among only a few senior engineers.
- Workload distribution is uneven across teams.
These insights encourage organizational improvements such as:
- Better documentation
- Cross-team knowledge sharing
- Balanced review responsibilities
- Improved onboarding processes
The result is stronger collaboration and fewer delivery risks.
Creating Feedback Loops for Continuous Improvement
The highest-performing engineering organizations treat analytics as an ongoing feedback system rather than a reporting exercise.
A typical improvement cycle looks like this:
- Measure current performance.
- Identify a bottleneck or inefficiency.
- Implement a targeted improvement.
- Monitor relevant metrics.
- Evaluate the results.
- Repeat the process.
This continuous cycle allows organizations to make steady, evidence-based improvements without introducing unnecessary disruption.
Over time, even modest gains accumulate into significant improvements in delivery performance.
Building a Healthy Metrics Culture
Data is only valuable when teams trust how it is used.
Elite engineering organizations avoid turning analytics into a tool for evaluating individual developers.
Instead, they focus on improving systems and processes.
Healthy metrics cultures emphasize:
- Transparency about what is measured
- Shared ownership of improvements
- Open discussion of engineering challenges
- Learning from trends instead of assigning blame
- Continuous experimentation
When developers understand that analytics exists to remove obstacles rather than monitor behavior, they are more likely to contribute ideas and engage with improvement initiatives.
Trust transforms metrics from a source of anxiety into a catalyst for innovation.
Practical Examples of Data-Driven Improvement
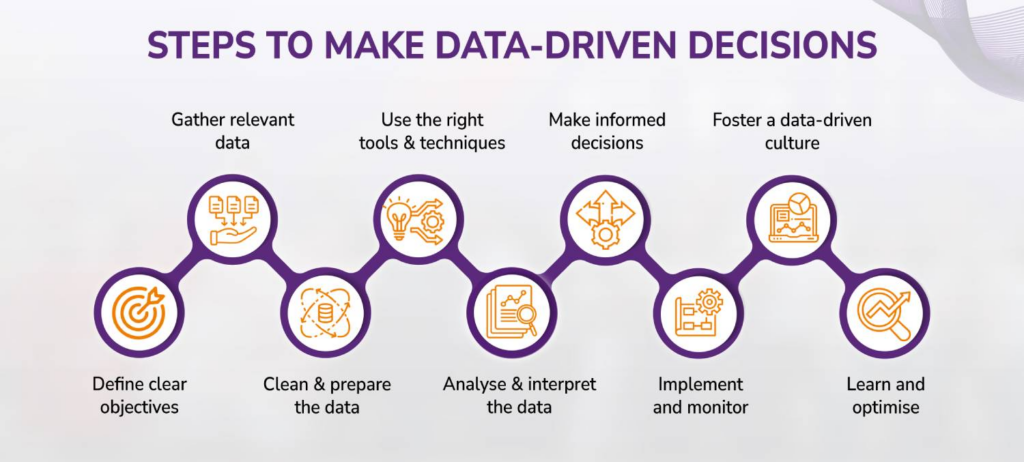
Many organizations have achieved meaningful results through relatively simple process improvements informed by engineering analytics.
Examples include:
- Reducing pull request size to shorten review times.
- Automating repetitive deployment tasks to increase release frequency.
- Improving documentation to reduce onboarding time for new engineers.
- Identifying unstable test suites and improving pipeline reliability.
- Investing in development environments to reduce setup time.
- Refactoring frequently modified components to lower maintenance effort.
None of these initiatives requires dramatic organizational change. Instead, they address specific friction points that analytics has brought to light.
Small, measurable improvements often have a greater cumulative impact than large-scale transformations.
Data as a Competitive Advantage
As software organizations grow, relying on intuition alone becomes increasingly difficult. Engineering leaders need objective insights to understand how work flows, where inefficiencies exist, and which improvements will deliver the greatest value.
Elite engineering teams use data not to measure individual productivity but to strengthen the systems that support high-quality software delivery. By identifying bottlenecks, validating process improvements, and balancing speed with reliability, they create an environment where continuous optimization becomes part of everyday engineering.
The result is more predictable delivery, healthier development workflows, stronger collaboration, and greater business value. Organizations that embrace engineering analytics as a strategic capability are better equipped to adapt, innovate, and consistently deliver exceptional software in an increasingly competitive landscape.

